Equities
US Equities Did Relatively Well This Week, Despite A Selloff Ahead Of Potential Weekend Surprises
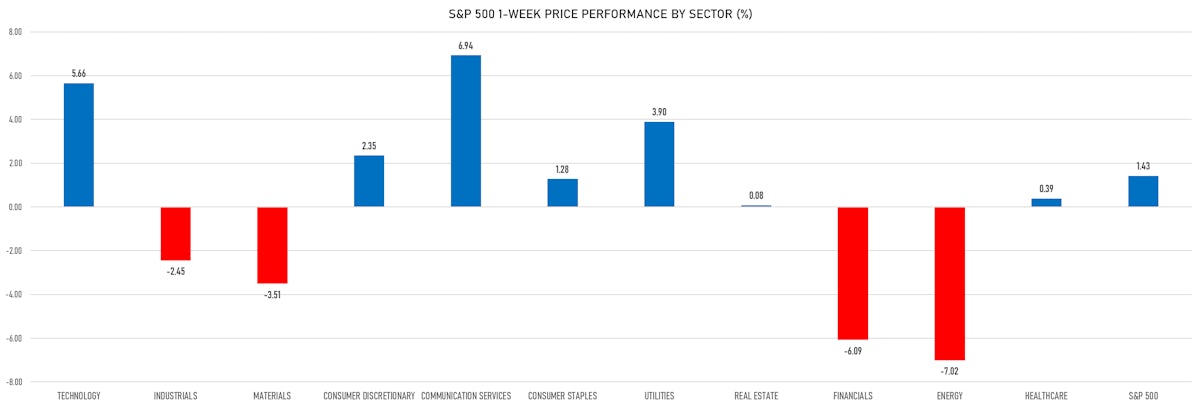
Defensives and highly liquid stocks outperformed this week, as the downside focus was obviously on weak balance sheets and rates sensitive sectors like regional financials
Published ET
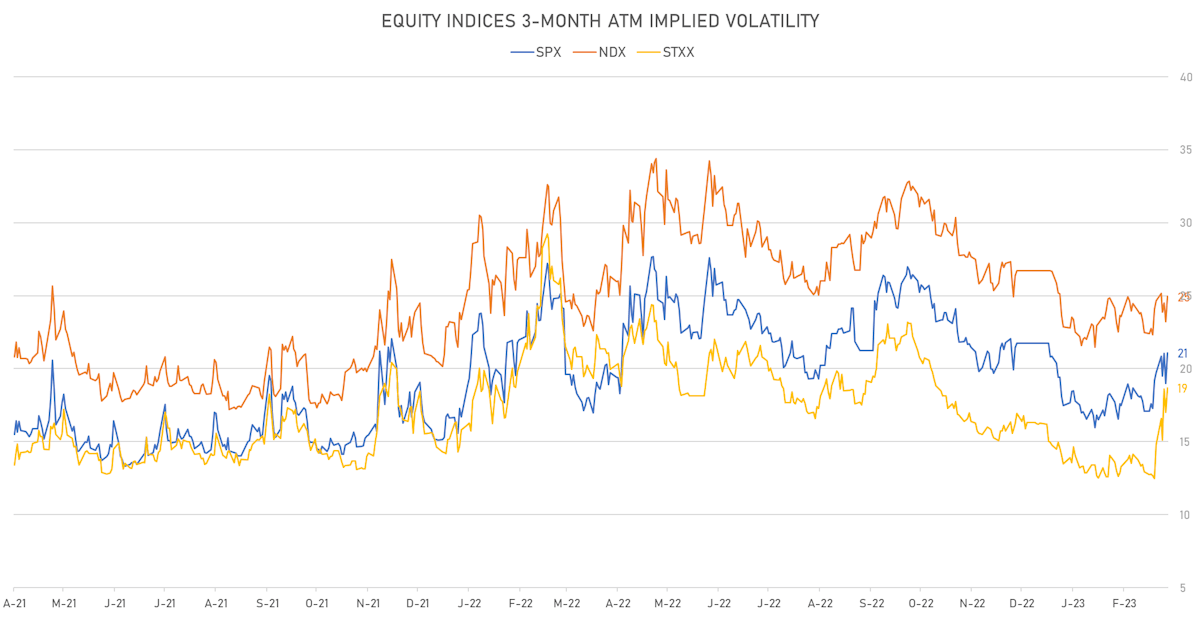
Equity Indices 3M ATM Implied Volatilities | Sources: phipost.com, Refinitiv data
DAILY SUMMARY
- Daily performance of US indices: S&P 500 down -1.10%; Nasdaq Composite down -0.74%; Wilshire 5000 down -0.60%
- 8.5% of S&P 500 stocks were up today, with 37.6% of stocks above their 200-day moving average (DMA) and 19.9% above their 50-DMA
- Top performing sectors in the S&P 500: technology down -0.11% and communication services down -0.48%
- Bottom performing sectors in the S&P 500: financials down -3.29% and real estate down -2.27%
- The number of shares in the S&P 500 traded today was 2635m for a total turnover of US$ 224 bn
- The S&P 500 Value Index Index was down -1.6%, while the S&P 500 Growth Index Index was down -0.7%; the S&P small caps index was down -3.0% and mid caps were down -2.5%
- The volume on CME's INX (S&P 500 Index) was 5761.3m (3-month z-score: 4.6); the 3-month average volume is 2545.1m and the 12-month range is 903.0 - 5761.3m
- Daily performance of international indices: Europe Stoxx 600 down -1.21%; UK FTSE 100 down -1.01%; Hang Seng SH-SZ-HK 300 Index up 0.97%; Japan's TOPIX 500 up 1.17%
VOLATILITY TODAY
- 3-month at-the-money implied volatility on the S&P 500 at 21.1%, up from 19.0%
- 3-month at-the-money implied volatility on the STOXX Europe 600 at 19.6%, up from 17.9%
TOP WINNERS TODAY
- Bakkt Holdings Inc (BKKT), up 44.5% to $1.72 / YTD price return: +44.5% / 12-Month Price Range: $ 1.08-7.76 / Short interest (% of float): 21.7%; days to cover: 4.3
- Home Point Capital Inc (HMPT), up 40.9% to $2.55 / YTD price return: +86.1% / 12-Month Price Range: $ 0.99-4.65 / Short interest (% of float): 1.9%; days to cover: 9.3
- Omega Therapeutics Inc (OMGA), up 25.2% to $9.78 / YTD price return: +71.3% / 12-Month Price Range: $ 1.98-11.98 / Short interest (% of float): 0.9%; days to cover: 6.1
- Traeger Inc (COOK), up 21.6% to $3.66 / YTD price return: +29.8% / 12-Month Price Range: $ 2.48-9.91 / Short interest (% of float): 7.9%; days to cover: 9.1
- PepGen Inc (PEPG), up 20.5% to $17.70 / YTD price return: +32.4% / 12-Month Price Range: $ 4.32-17.99 / Short interest (% of float): 0.9%; days to cover: 5.4
- Cipher Mining Inc (CIFR), up 18.4% to $2.32 / YTD price return: +314.3% / 12-Month Price Range: $ 0.38-3.94 / Short interest (% of float): 17.1%; days to cover: 5.2
- Caledonia Mining Corporation PLC (CMCL), up 17.8% to $16.66 / YTD price return: +34.4% / 12-Month Price Range: $ 8.75-18.23 / Short interest (% of float): 0.4%; days to cover: 1.0
- Waldencast PLC (WALD), up 15.0% to $9.20 / 12-Month Price Range: $ 6.56-12.10 / Short interest (% of float): 0.1%; days to cover: 17.3
- Riot Platforms Inc (RIOT), up 14.9% to $8.10 / YTD price return: +138.9% / 12-Month Price Range: $ 3.25-23.66 / Short interest (% of float): 20.5%; days to cover: 1.9
- LiveVox Holdings Inc (LVOX), up 14.6% to $2.82 / YTD price return: -5.1% / 12-Month Price Range: $ 1.40-3.50 / Short interest (% of float): 3.6%; days to cover: 15.1
BIGGEST LOSERS TODAY
- Nexters Inc (GDEV), down 35.9% to $3.68 / YTD price return: -42.3% / 12-Month Price Range: $ 3.68-6.20 / Short interest (% of float): 1.1%; days to cover: #N/A (the stock is currently on the short sale restriction list)
- First Republic Bank (FRC), down 32.8% to $23.03 / YTD price return: -81.1% / 12-Month Price Range: $ 17.53-174.21 / Short interest (% of float): 2.8%; days to cover: 3.0 (the stock is currently on the short sale restriction list)
- Gohealth Inc (GOCO), down 24.5% to $13.22 / YTD price return: +26.5% / 12-Month Price Range: $ 4.94-25.50 / Short interest (% of float): 7.0%; days to cover: 5.9 (the stock is currently on the short sale restriction list)
- Semantix Inc (STIX), down 24.1% to $3.40 / 12-Month Price Range: $ .55-11.34 / Short interest (% of float): 0.1%; days to cover: 0.4 (the stock is currently on the short sale restriction list)
- Purple Innovation Inc (PRPL), down 19.7% to $2.65 / YTD price return: -44.7% / 12-Month Price Range: $ 2.65-7.97 / Short interest (% of float): 5.7%; days to cover: 6.4 (the stock is currently on the short sale restriction list)
- PacWest Bancorp (PACW), down 19.0% to $9.28 / YTD price return: -59.6% / 12-Month Price Range: $ 5.00-46.76 / Short interest (% of float): 3.6%; days to cover: 2.7 (the stock is currently on the short sale restriction list)
- Sarepta Therapeutics Inc (SRPT), down 18.0% to $122.69 / YTD price return: -5.3% / 12-Month Price Range: $ 61.28-159.84 / Short interest (% of float): 9.7%; days to cover: 8.3 (the stock is currently on the short sale restriction list)
- Emergent BioSolutions Inc (EBS), down 15.9% to $8.12 / YTD price return: -31.2% / 12-Month Price Range: $ 8.12-45.14 / Short interest (% of float): 12.4%; days to cover: 5.2 (the stock is currently on the short sale restriction list)
- CareMax Inc (CMAX), down 15.8% to $3.07 / YTD price return: -16.0% / 12-Month Price Range: $ 2.77-9.23 / Short interest (% of float): 7.5%; days to cover: 13.8 (the stock is currently on the short sale restriction list)
- Western Alliance Bancorp (WAL), down 15.1% to $31.32 / YTD price return: -47.4% / 12-Month Price Range: $ 7.46-89.26 / Short interest (% of float): 2.5%; days to cover: 2.7 (the stock is currently on the short sale restriction list)
TOP S&P 500 PERFORMERS THIS WEEK
- Advanced Micro Devices Inc (AMD), up 18.4% to $97.84 / YTD price return: +51.1% / 12-Month Price Range: $ 54.58-125.66 / Short interest (% of float): 2.1%; days to cover: 0.6
- Illumina Inc (ILMN), up 15.7% to $224.55 / YTD price return: +11.1% / 12-Month Price Range: $ 173.48-370.98 / Short interest (% of float): 2.8%; days to cover: 3.6
- Newmont Corporation (NEM), up 14.3% to $48.17 / YTD price return: +2.1% / 12-Month Price Range: $ 37.45-86.37 / Short interest (% of float): 1.2%; days to cover: 1.3
- Alphabet Inc (GOOG), up 12.6% to $102.46 / YTD price return: +15.5% / 12-Month Price Range: $ 83.46-144.07 / Short interest (% of float): 0.6%; days to cover: 0.8
- Marketaxess Holdings Inc (MKTX), up 12.4% to $389.77 / YTD price return: +39.8% / 12-Month Price Range: $ 217.97-390.25 / Short interest (% of float): 2.5%; days to cover: 2.7
- Microsoft Corp (MSFT), up 12.4% to $279.43 / YTD price return: +16.5% / 12-Month Price Range: $ 213.46-315.94 / Short interest (% of float): 0.5%; days to cover: 1.0
- Alphabet Inc (GOOGL), up 12.1% to $101.62 / YTD price return: +15.2% / 12-Month Price Range: $ 83.34-143.75 / Short interest (% of float): 0.7%; days to cover: 0.9
- NVIDIA Corp (NVDA), up 12.0% to $257.25 / YTD price return: +76.0% / 12-Month Price Range: $ 108.14-289.34 / Short interest (% of float): 1.6%; days to cover: 0.7
- Arista Networks Inc (ANET), up 11.5% to $163.26 / YTD price return: +34.5% / 12-Month Price Range: $ 89.13-164.23 / Short interest (% of float): 1.3%; days to cover: 1.3
- Insulet Corp (PODD), up 10.2% to $309.09 / YTD price return: +5.0% / 12-Month Price Range: $ 181.60-320.00 / Short interest (% of float): 3.5%; days to cover: 5.5
BOTTOM S&P 500 PERFORMERS THIS WEEK
- First Republic Bank (FRC), down 71.8% to $23.03 / YTD price return: -81.1% / 12-Month Price Range: $ 17.53-174.21 / Short interest (% of float): 2.8%; days to cover: 3.0 (the stock is currently on the short sale restriction list)
- KeyCorp (KEY), down 26.4% to $11.53 / YTD price return: -33.8% / 12-Month Price Range: $ 9.61-24.62 / Short interest (% of float): 2.3%; days to cover: 1.6 (the stock is currently on the short sale restriction list)
- Comerica Inc (CMA), down 25.9% to $43.59 / YTD price return: -34.8% / 12-Month Price Range: $ 29.17-97.41 / Short interest (% of float): 2.4%; days to cover: 2.0 (the stock is currently on the short sale restriction list)
- Zions Bancorporation NA (ZION), down 25.8% to $29.94 / YTD price return: -39.1% / 12-Month Price Range: $ 22.55-71.17 / Short interest (% of float): 2.5%; days to cover: 2.4
- Huntington Bancshares Inc (HBAN), down 22.7% to $10.34 / YTD price return: -26.7% / 12-Month Price Range: $ 9.94-15.74 / Short interest (% of float): 3.1%; days to cover: 3.3
- Truist Financial Corp (TFC), down 21.3% to $30.56 / YTD price return: -29.0% / 12-Month Price Range: $ 28.70-61.10 / Short interest (% of float): 1.1%; days to cover: 2.4 (the stock is currently on the short sale restriction list)
- Lincoln National Corp (LNC), down 20.9% to $20.30 / YTD price return: -33.9% / 12-Month Price Range: $ 20.30-69.90 / Short interest (% of float): 4.1%; days to cover: 2.0
- US Bancorp (USB), down 18.9% to $32.95 / YTD price return: -24.4% / 12-Month Price Range: $ 32.72-57.90 / Short interest (% of float): 0.6%; days to cover: 1.4
- Fifth Third Bancorp (FITB), down 17.8% to $24.95 / YTD price return: -24.0% / 12-Month Price Range: $ 22.11-48.03 / Short interest (% of float): 2.0%; days to cover: 2.6
- United Airlines Holdings Inc (UAL), down 15.6% to $43.04 / YTD price return: +14.2% / 12-Month Price Range: $ 31.58-55.04 / Short interest (% of float): 4.4%; days to cover: 1.8
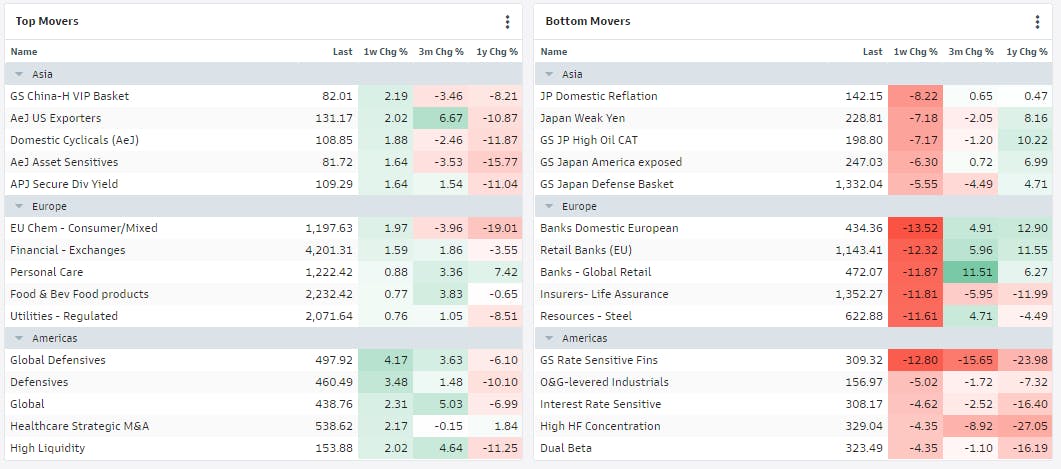
Goldman Sachs Baskets Top Movers | Source: GSIR
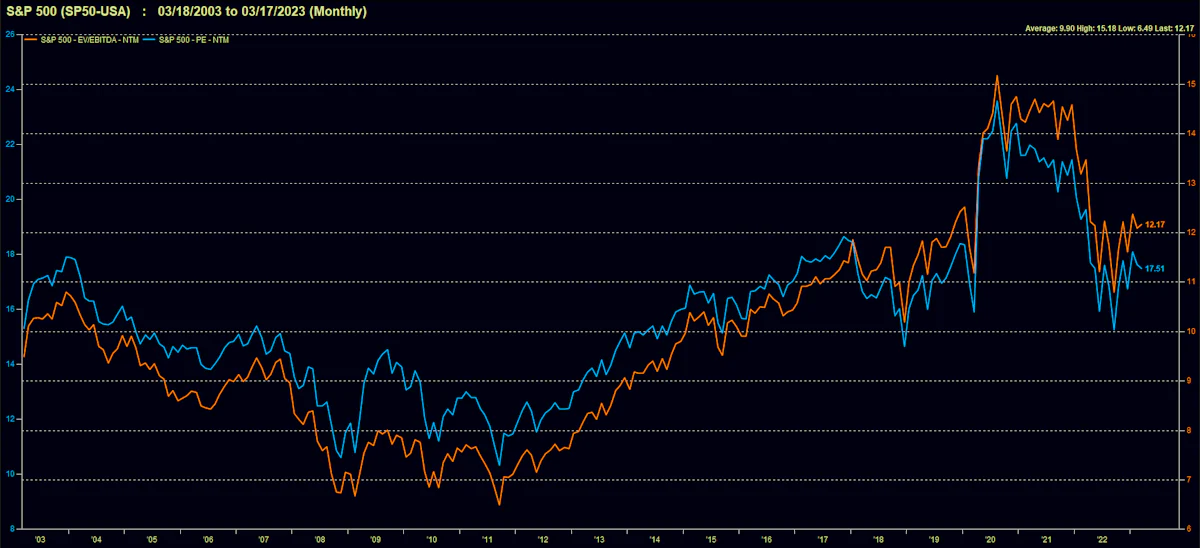
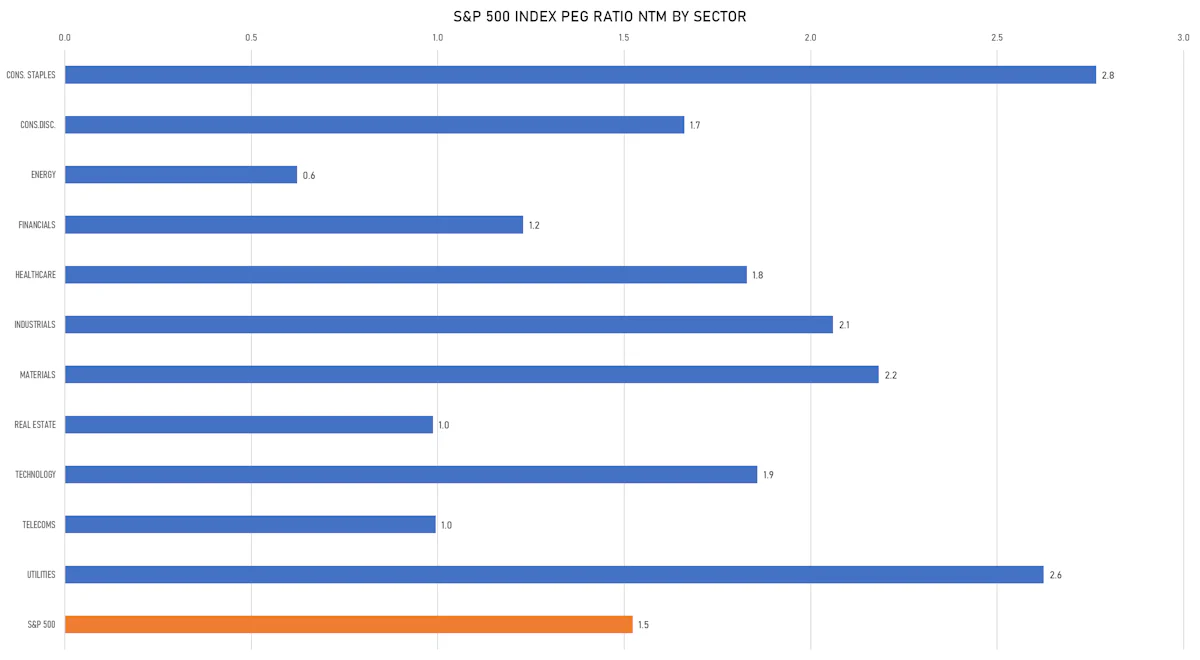
VALUATION MULTIPLES BY SECTORS
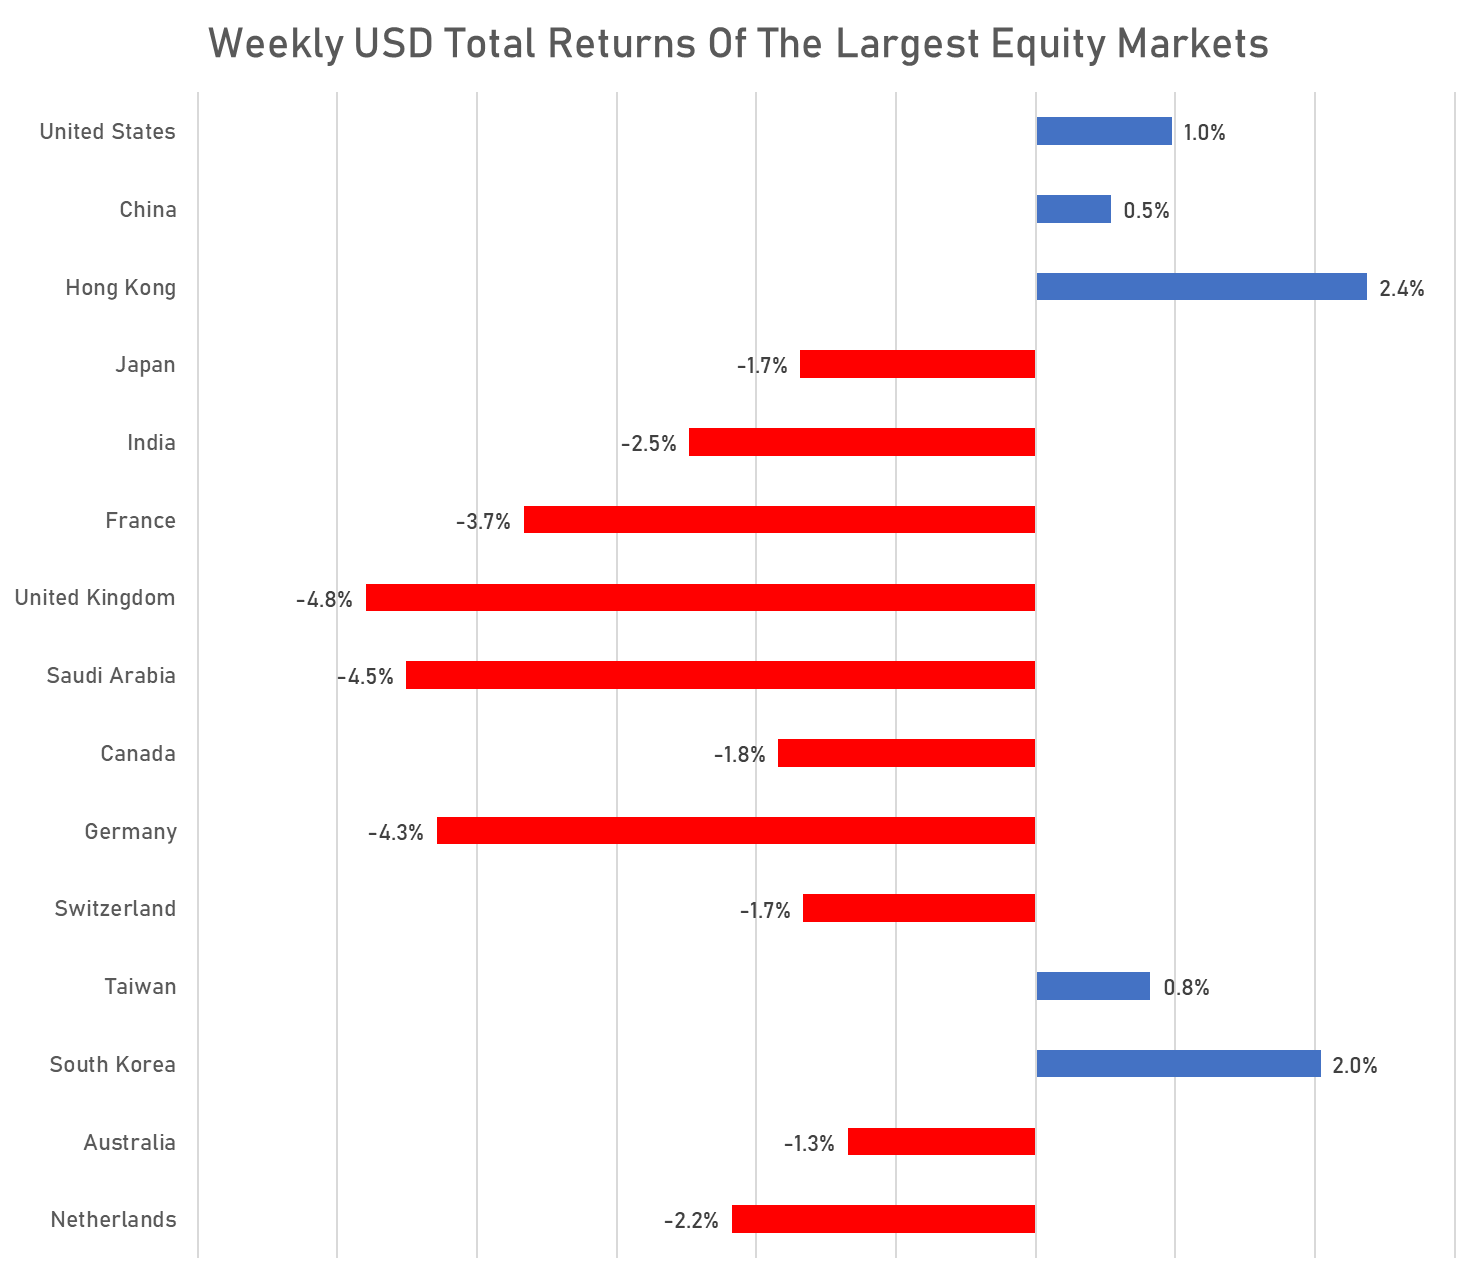
WEEKLY TOTAL RETURNS OF MAJOR GLOBAL EQUITY MARKETS
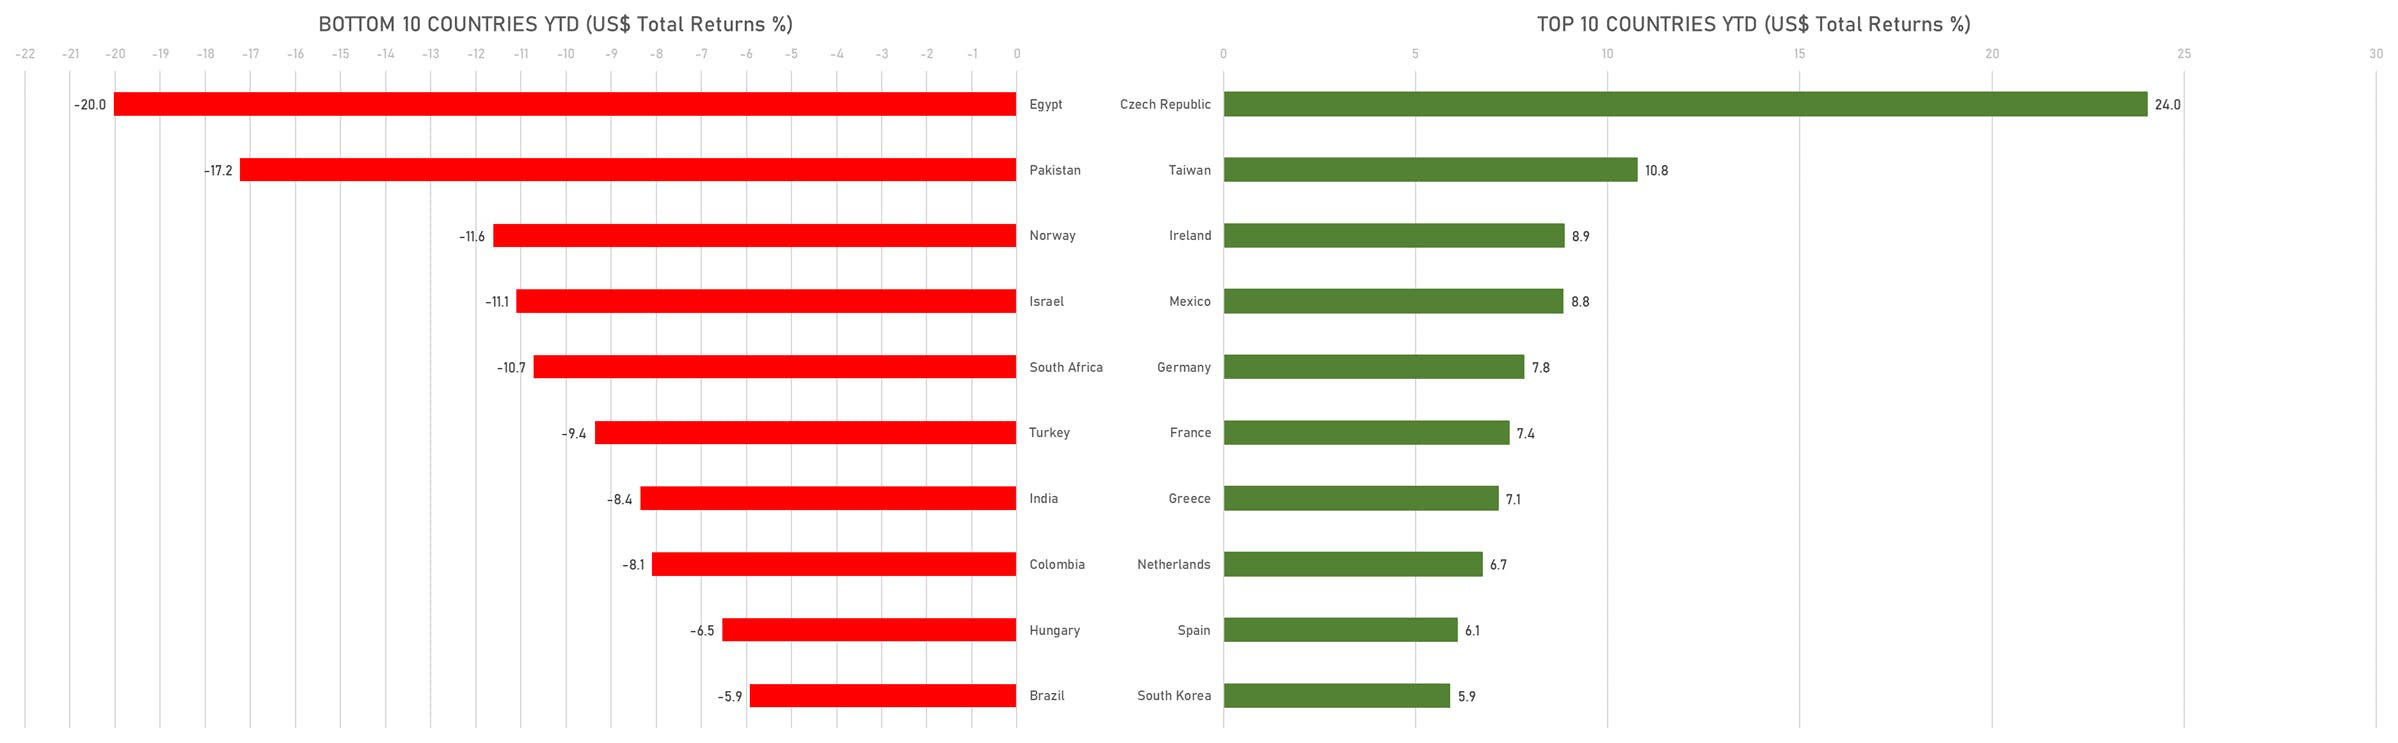
TOP / BOTTOM PERFORMING WORLD MARKETS YTD
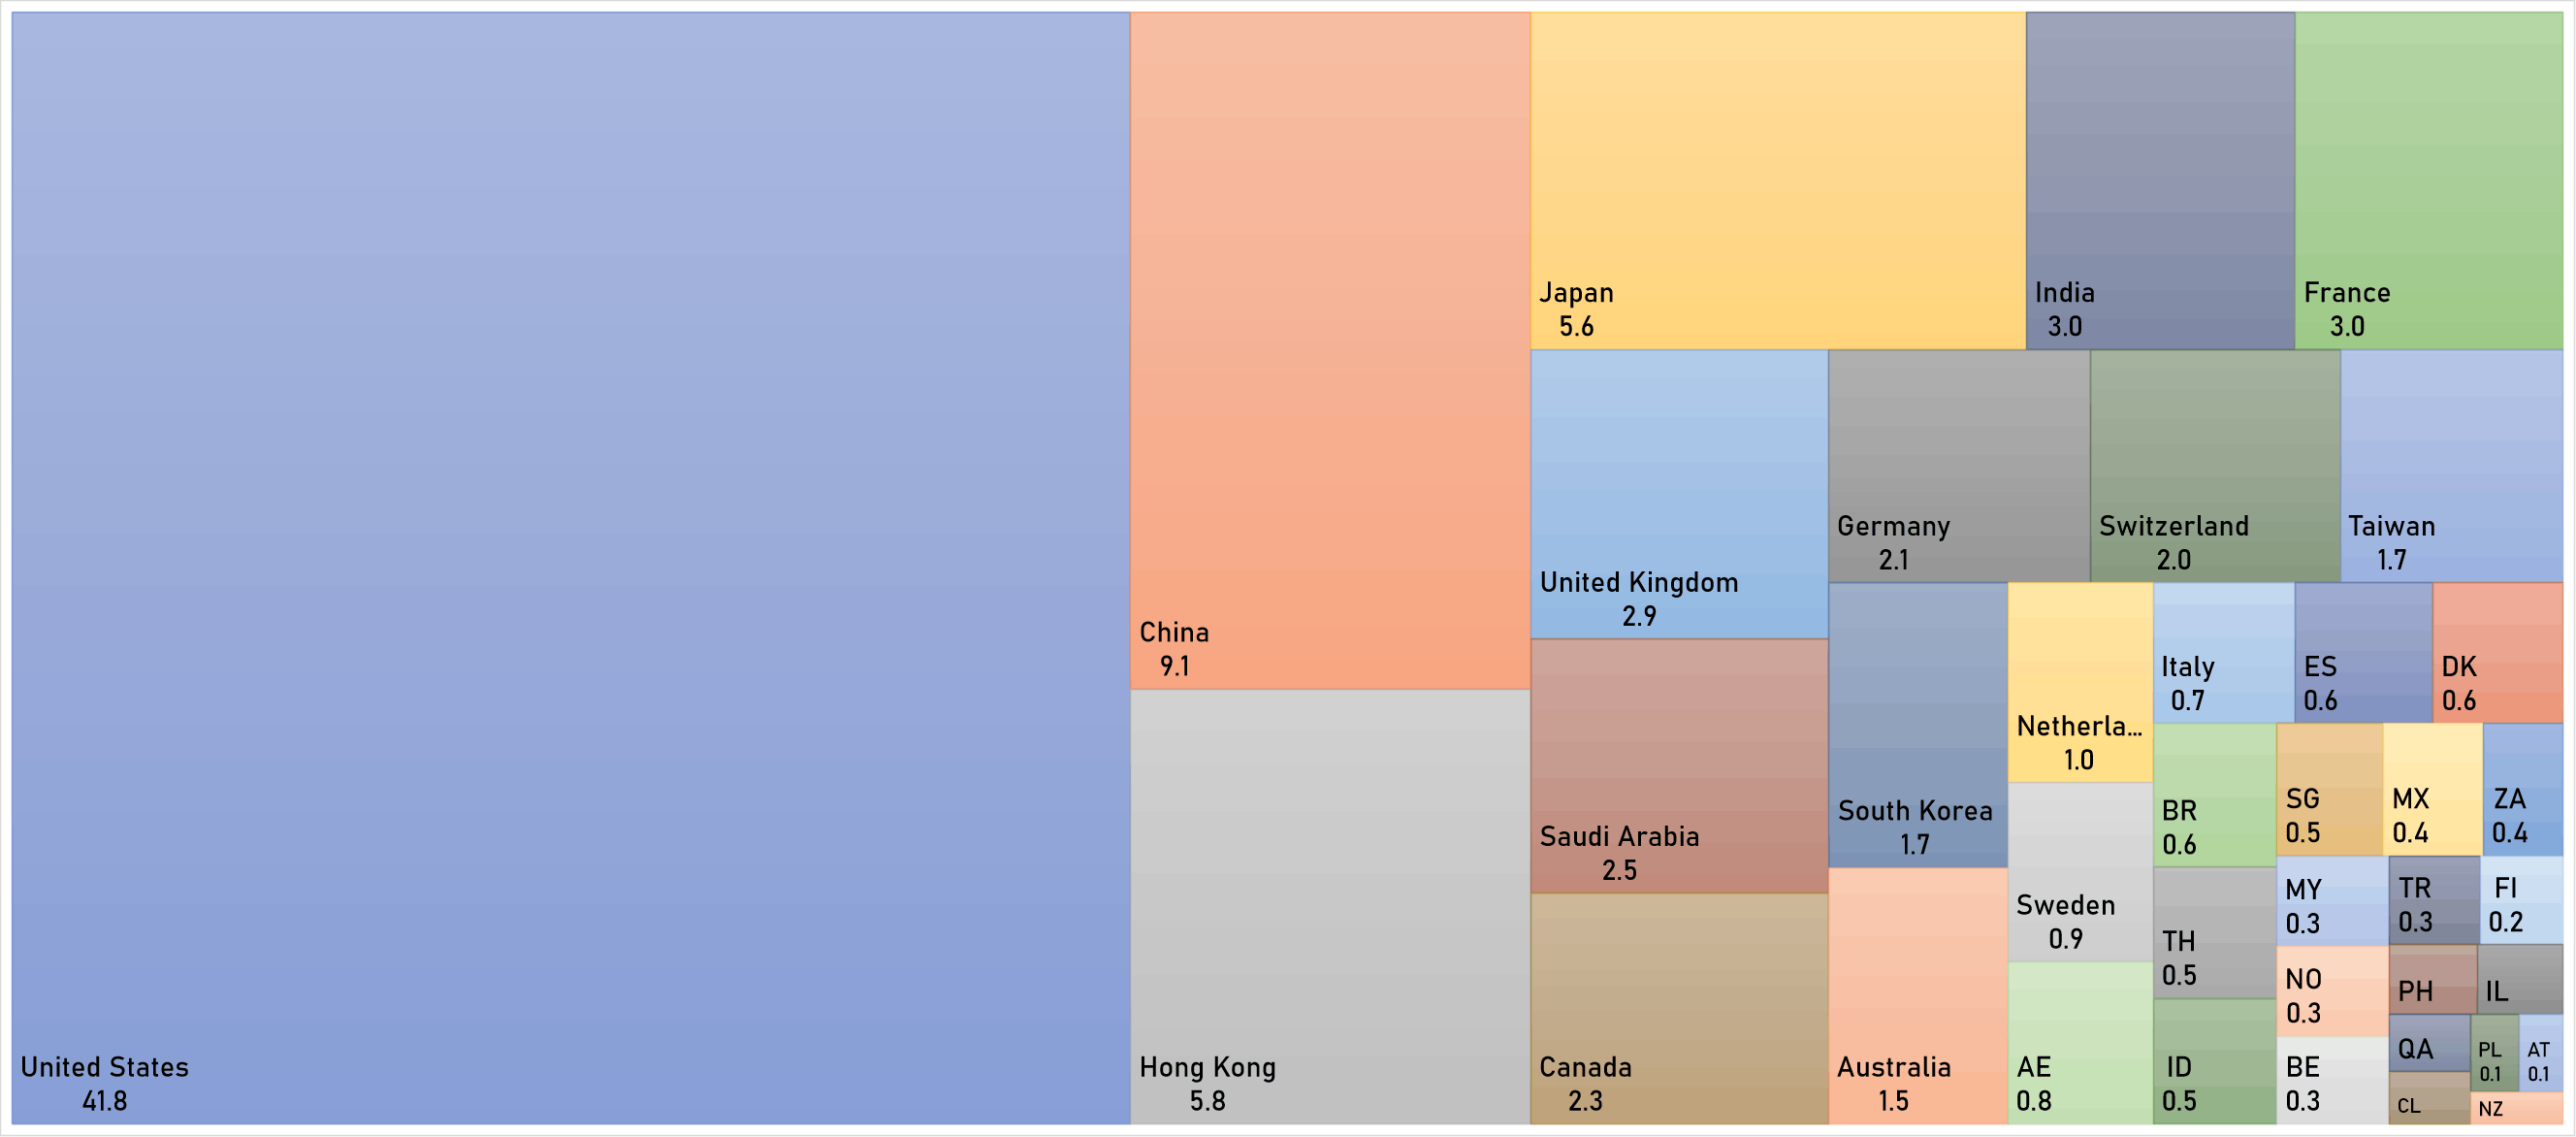
WORLD MARKET CAPITALIZATION (US$ Trillion)