Equities
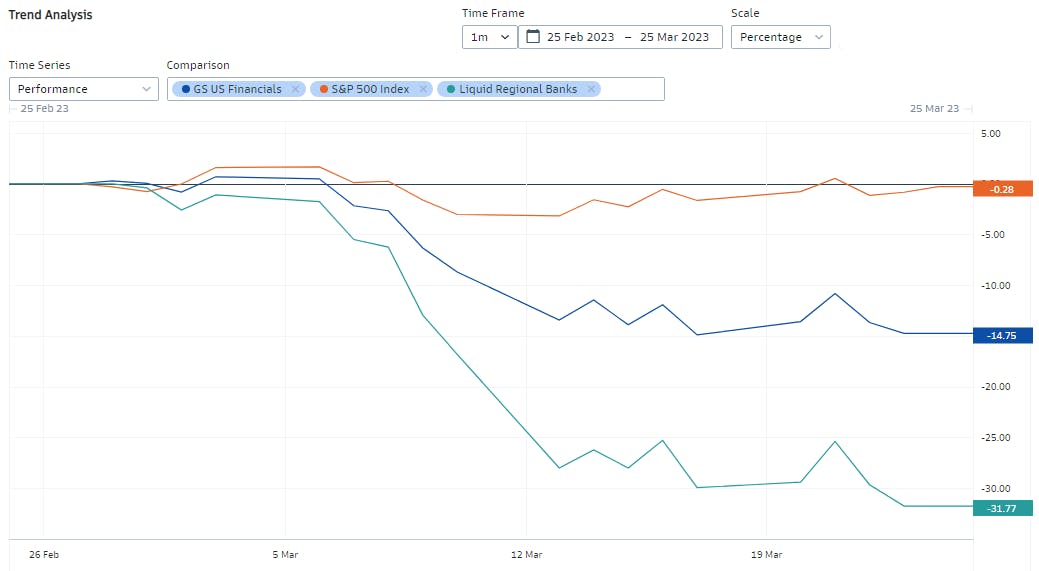
US Equities Rose Again This Week, Helped By A Stabilization Of Regional Financials
Despite the possible reversal of recent bearish positioning, we continue to see a challenged path ahead for US equities, with little upside to earnings and valuations
Published ET
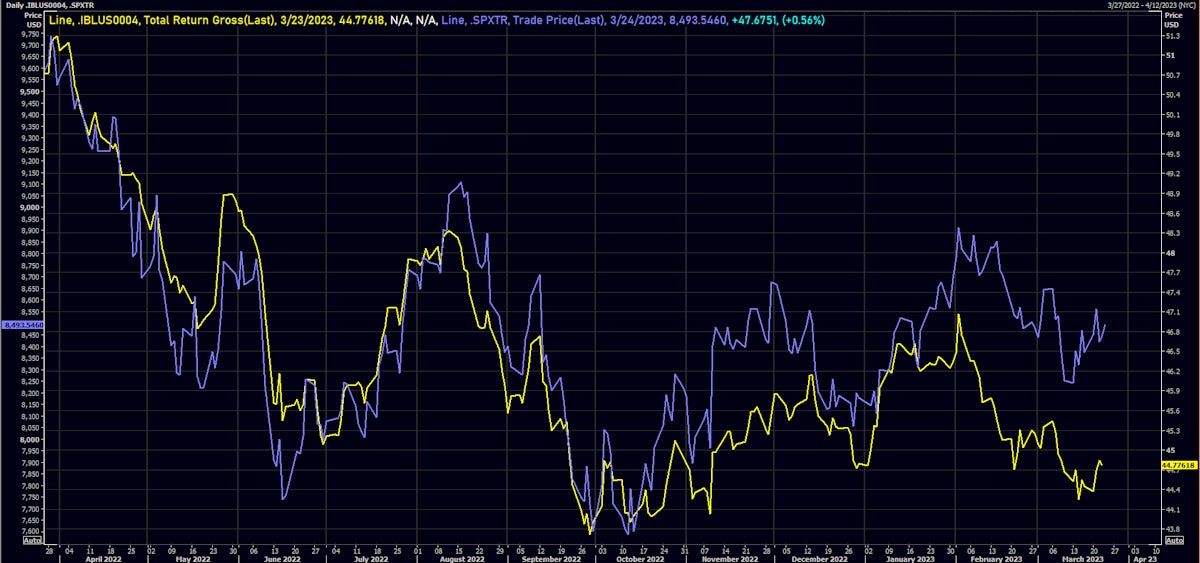
S&P 500 Total Returns vs iBOXX USD HY Liquid Bonds | Source: Refinitiv
DAILY SUMMARY
- Daily performance of US indices: S&P 500 up 0.56%; Nasdaq Composite up 0.31%; Wilshire 5000 down -0.19%
- 75.0% of S&P 500 stocks were up today, with 40.4% of stocks above their 200-day moving average (DMA) and 22.9% above their 50-DMA
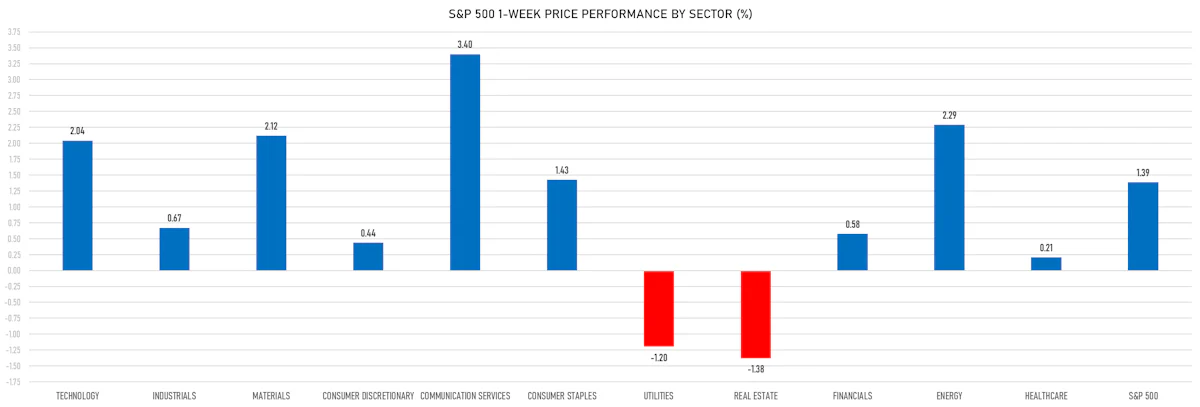
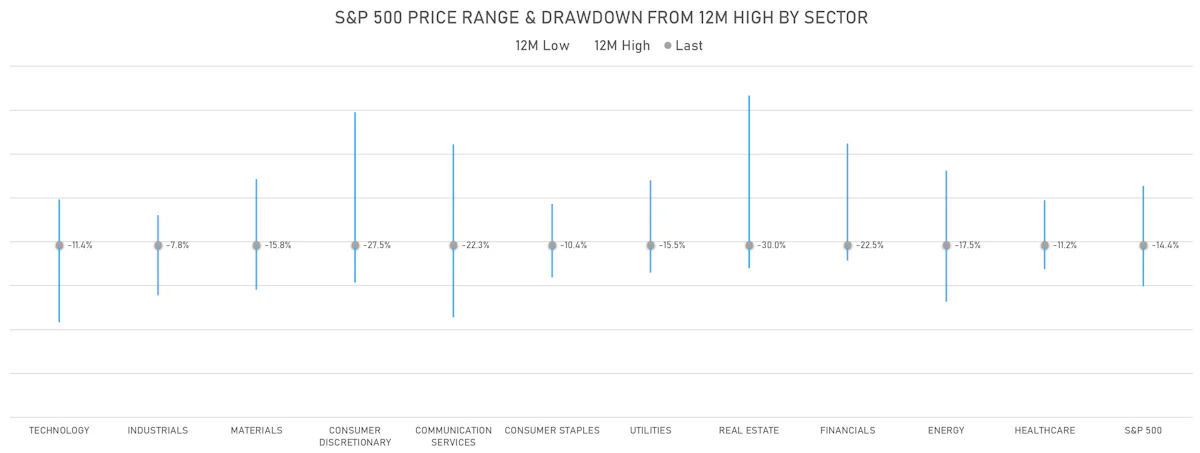
- Top performing sectors in the S&P 500: utilities up 3.12% and real estate up 2.57%
- Bottom performing sectors in the S&P 500: consumer discretionary down -0.35% and financials down -0.06%
- The number of shares in the S&P 500 traded today was 687m for a total turnover of US$ 62 bn
- The S&P 500 Value Index Index was up 0.7%, while the S&P 500 Growth Index Index was up 0.4%; the S&P small caps index was up 1.1% and mid caps were up 0.9%
- The volume on CME's INX (S&P 500 Index) was 2584.8m (3-month z-score: 0.1); the 3-month average volume is 2530.0m and the 12-month range is 903.0 - 5761.3m
- Daily performance of international indices: Europe Stoxx 600 down -1.37%; UK FTSE 100 down -1.26%; Hang Seng SH-SZ-HK 300 Index down -0.08%; Japan's TOPIX 500 down -0.11%
VOLATILITY TODAY
- 3-month at-the-money implied volatility on the S&P 500 at 19.3%, down from 19.4%
- 3-month at-the-money implied volatility on the STOXX Europe 600 at 17.5%, up from 15.8%
TOP WINNERS TODAY
- Virgin Orbit Holdings Inc (VORB), up 50.1% to $0.80 / YTD price return: -56.8% / 12-Month Price Range: $ 0.41-7.59 / Short interest (% of float): 1.1%; days to cover: 1.5
- Naas Technology Inc (NAAS), up 38.8% to $5.80 / YTD price return: +49.1% / 12-Month Price Range: $ 2.75-22.45 / Short interest (% of float): 0.1%; days to cover: 0.3
- Pharming Group NV (PHAR), up 32.7% to $14.96 / YTD price return: +35.6% / 12-Month Price Range: $ 6.10-15.00 / Short interest (% of float): 0.0%; days to cover: 0.4 (the stock is currently on the short sale restriction list)
- Danimer Scientific Inc (DNMR), up 23.9% to $2.59 / YTD price return: +44.7% / 12-Month Price Range: $ 1.57-6.78 / Short interest (% of float): 18.0%; days to cover: 11.5
- Renew Energy Global PLC (RNW), up 22.1% to $5.36 / YTD price return: -2.5% / 12-Month Price Range: $ 4.04-8.56 / Short interest (% of float): 1.9%
- Torrid Holdings Inc (CURV), up 21.8% to $2.90 / YTD price return: -2.0% / 12-Month Price Range: $ 2.19-8.29 / Short interest (% of float): 11.4%; days to cover: 12.2
- Vor Biopharma Inc (VOR), up 15.3% to $5.88 / YTD price return: -11.6% / 12-Month Price Range: $ 3.48-7.67 / Short interest (% of float): 3.3%; days to cover: 22.1
- ProKidney Corp (PROK), up 15.3% to $12.62 / YTD price return: +84.0% / 12-Month Price Range: $ 5.14-14.19 / Short interest (% of float): 3.0%; days to cover: 17.8
- Hesai Group (HSAI), up 15.1% to $16.23 / 12-Month Price Range: $ 11.60-30.36 / Short interest (% of float): 0.1%; days to cover: 0.1
- GH Research PLC (GHRS), up 14.8% to $7.93 / YTD price return: -18.4% / 12-Month Price Range: $ 5.70-20.32 / Short interest (% of float): 3.3%; days to cover: 15.1
BIGGEST LOSERS TODAY
- Summit Healthcare Acquisition Corp (YS), down 26.3% to $4.79 / YTD price return: -52.2% / 12-Month Price Range: $ 4.79-18.44 / Short interest (% of float): 0.0%; days to cover: 0.2 (the stock is currently on the short sale restriction list)
- Scholastic Corp (SCHL), down 22.3% to $32.12 / YTD price return: -18.6% / 12-Month Price Range: $ 28.22-48.28 / Short interest (% of float): 2.1%; days to cover: 4.0 (the stock is currently on the short sale restriction list)
- Aeva Technologies Inc (AEVA), down 16.9% to $1.18 / YTD price return: -13.2% / 12-Month Price Range: $ 1.17-4.64 / Short interest (% of float): 4.6%; days to cover: 5.2 (the stock is currently on the short sale restriction list)
- Lilium NV (LILM), down 15.3% to $.67 / YTD price return: -40.9% / 12-Month Price Range: $ .67-5.52 / Short interest (% of float): 5.0%; days to cover: 5.5 (the stock is currently on the short sale restriction list)
- Ouster Inc (OUST), down 13.7% to $.78 / YTD price return: -9.6% / 12-Month Price Range: $ .76-5.00 / Short interest (% of float): 5.6%; days to cover: 7.7 (the stock is currently on the short sale restriction list)
- Oxford Industries Inc (OXM), down 12.7% to $101.72 / YTD price return: +9.2% / 12-Month Price Range: $ 77.81-123.37 / Short interest (% of float): 7.7%; days to cover: 9.6 (the stock is currently on the short sale restriction list)
- Semantix Inc (STIX), down 12.4% to $3.68 / YTD price return: +317.9% / 12-Month Price Range: $ .55-11.34 / Short interest (% of float): 0.1%; days to cover: 0.4 (the stock is currently on the short sale restriction list)
- indie Semiconductor Inc (INDI), down 10.7% to $9.77 / YTD price return: +67.6% / 12-Month Price Range: $ 5.07-11.12 / Short interest (% of float): 15.4%; days to cover: 5.9 (the stock is currently on the short sale restriction list)
- Exscientia PLC (EXAI), down 10.1% to $6.25 / YTD price return: +17.3% / 12-Month Price Range: $ 4.09-16.45 (the stock is currently on the short sale restriction list)
- PepGen Inc (PEPG), down 9.8% to $15.23 / YTD price return: +13.9% / 12-Month Price Range: $ 4.32-19.00 / Short interest (% of float): 0.9%; days to cover: 5.4 (the stock is currently on the short sale restriction list)
TOP S&P 500 PERFORMERS THIS WEEK
- Regeneron Pharmaceuticals Inc (REGN), up 9.7% to $820.00 / YTD price return: +13.7% / 12-Month Price Range: $ 538.27-820.00 / Short interest (% of float): 1.1%; days to cover: 1.9
- Match Group Inc (MTCH), up 9.5% to $40.20 / YTD price return: -3.1% / 12-Month Price Range: $ 34.63-114.05 / Short interest (% of float): 3.4%; days to cover: 2.1
- Accenture PLC (ACN), up 8.8% to $272.00 / YTD price return: +1.9% / 12-Month Price Range: $ 242.86-345.24 / Short interest (% of float): 0.8%; days to cover: 2.7
- APA Corp (US) (APA), up 8.7% to $34.51 / YTD price return: -26.1% / 12-Month Price Range: $ 30.15-51.95 / Short interest (% of float): 3.7%; days to cover: 2.1
- Netflix Inc (NFLX), up 8.2% to $328.39 / YTD price return: +11.4% / 12-Month Price Range: $ 162.81-396.47 / Short interest (% of float): 1.9%; days to cover: 1.0
- Carnival Corp (CCL), up 8.0% to $9.23 / YTD price return: +14.5% / 12-Month Price Range: $ 6.12-21.49 / Short interest (% of float): 12.1%; days to cover: 3.3
- Micron Technology Inc (MU), up 7.9% to $61.16 / YTD price return: +22.4% / 12-Month Price Range: $ 48.43-86.23 / Short interest (% of float): 1.7%; days to cover: 1.4
- Intuitive Surgical Inc (ISRG), up 7.8% to $256.42 / YTD price return: -3.4% / 12-Month Price Range: $ 180.34-308.21 / Short interest (% of float): 0.6%; days to cover: 1.1
- Truist Financial Corp (TFC), up 7.6% to $32.89 / YTD price return: -23.6% / 12-Month Price Range: $ 28.70-61.10 / Short interest (% of float): 1.1%; days to cover: 2.4
- Assurant Inc (AIZ), up 7.5% to $112.77 / YTD price return: -9.8% / 12-Month Price Range: $ 104.54-194.11 / Short interest (% of float): 2.1%; days to cover: 2.8
BOTTOM S&P 500 PERFORMERS THIS WEEK
- First Republic Bank (FRC), down 46.3% to $12.36 / YTD price return: -89.9% / 12-Month Price Range: $ 11.52-173.49 / Short interest (% of float): 2.8%; days to cover: 3.0
- Comerica Inc (CMA), down 7.3% to $40.40 / YTD price return: -39.6% / 12-Month Price Range: $ 29.17-97.40 / Short interest (% of float): 2.4%; days to cover: 2.0 (the stock is currently on the short sale restriction list)
- Advance Auto Parts Inc (AAP), down 7.2% to $110.83 / YTD price return: -24.6% / 12-Month Price Range: $ 110.30-231.14
- CBRE Group Inc (CBRE), down 6.8% to $68.86 / YTD price return: -10.5% / 12-Month Price Range: $ 66.34-94.19
- Digital Realty Trust Inc (DLR), down 6.3% to $94.37 / YTD price return: -5.9% / 12-Month Price Range: $ 85.82-153.50
- M&T Bank Corp (MTB), down 6.2% to $114.93 / YTD price return: -20.8% / 12-Month Price Range: $ 112.32-193.42 / Short interest (% of float): 1.3%; days to cover: 1.6
- Zions Bancorporation NA (ZION), down 5.6% to $28.25 / YTD price return: -42.5% / 12-Month Price Range: $ 22.55-71.17 / Short interest (% of float): 2.5%; days to cover: 2.4
- Charles Schwab Corp (SCHW), down 5.6% to $53.26 / YTD price return: -36.0% / 12-Month Price Range: $ 45.00-93.14
- VF Corp (VFC), down 5.3% to $20.29 / YTD price return: -26.5% / 12-Month Price Range: $ 20.14-60.09
- Pool Corp (POOL), down 4.9% to $325.23 / YTD price return: +7.6% / 12-Month Price Range: $ 278.39-471.96
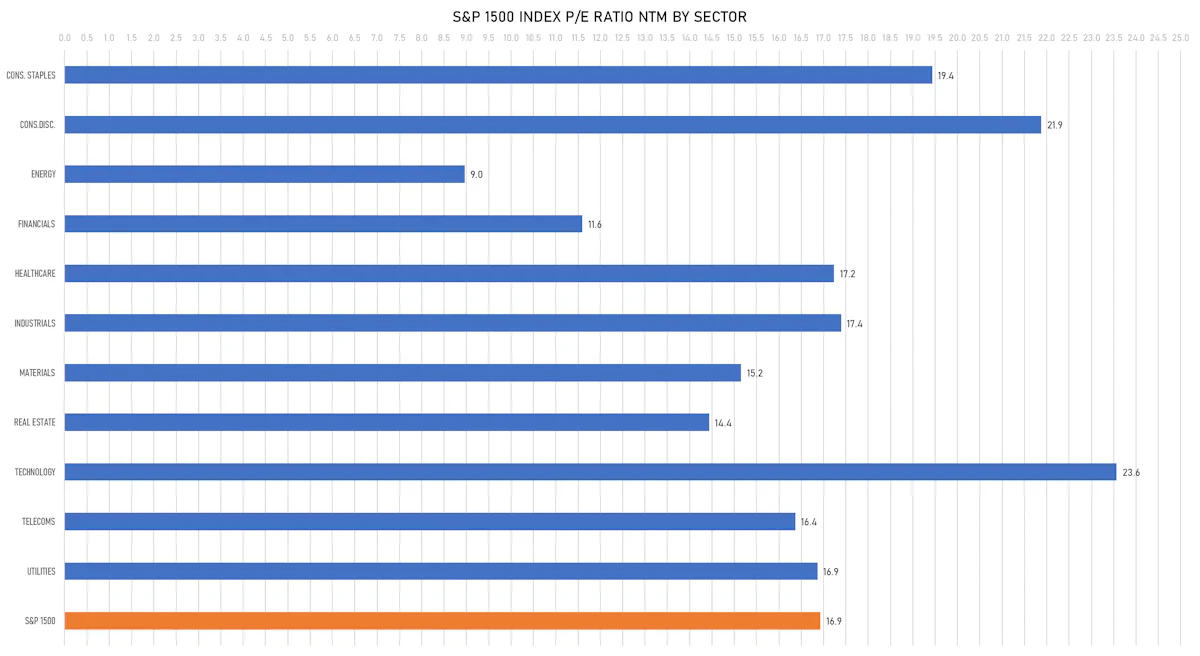
VALUATION MULTIPLES BY SECTORS
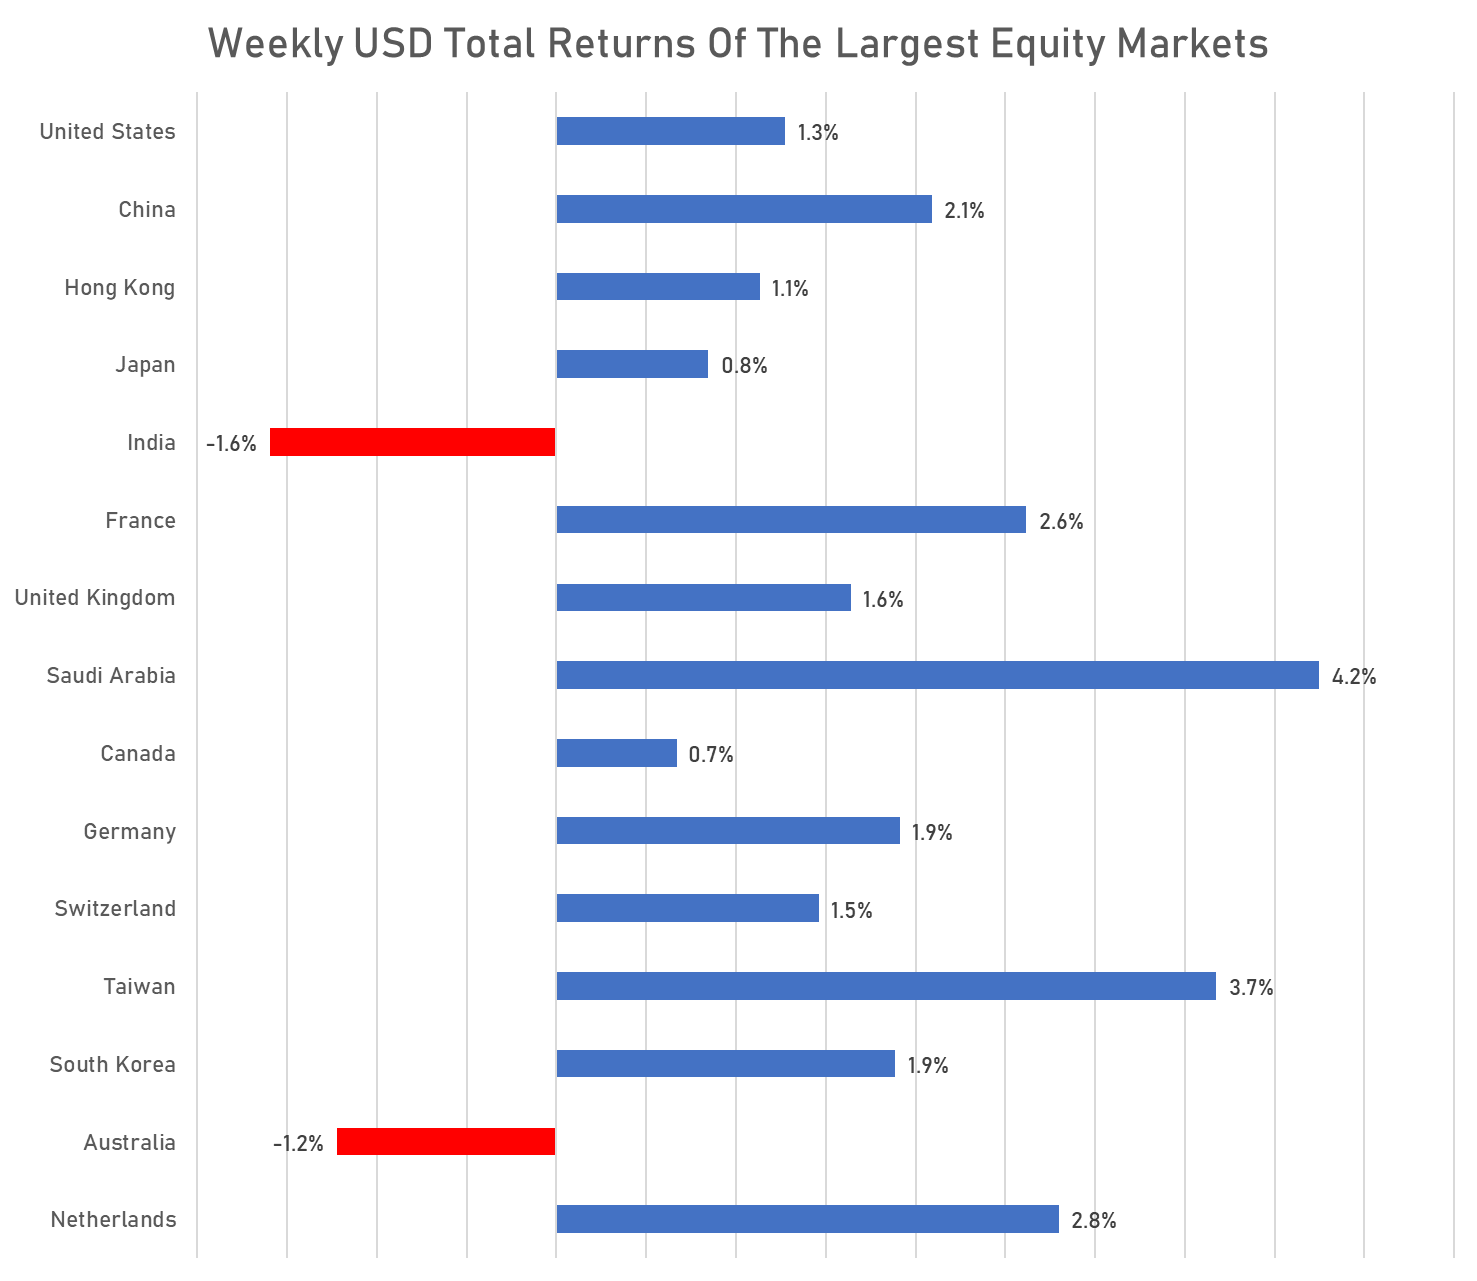
WEEKLY TOTAL RETURNS OF MAJOR GLOBAL EQUITY MARKETS
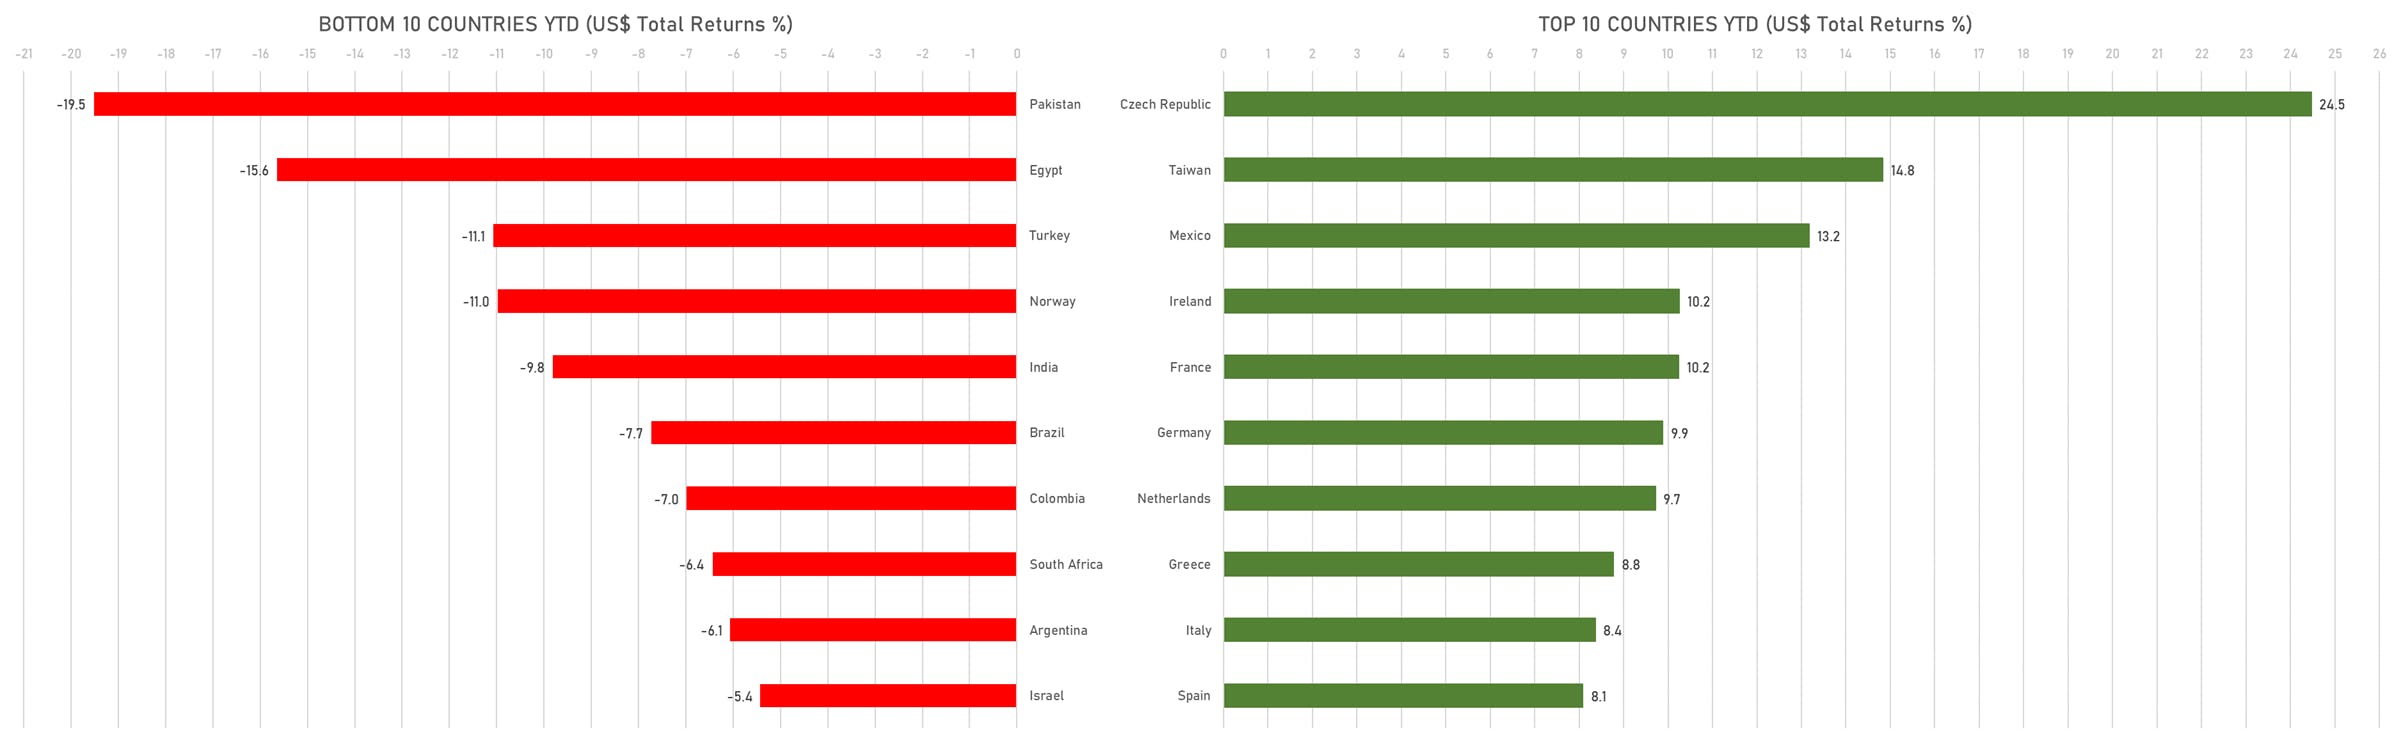
TOP / BOTTOM PERFORMING WORLD MARKETS YTD
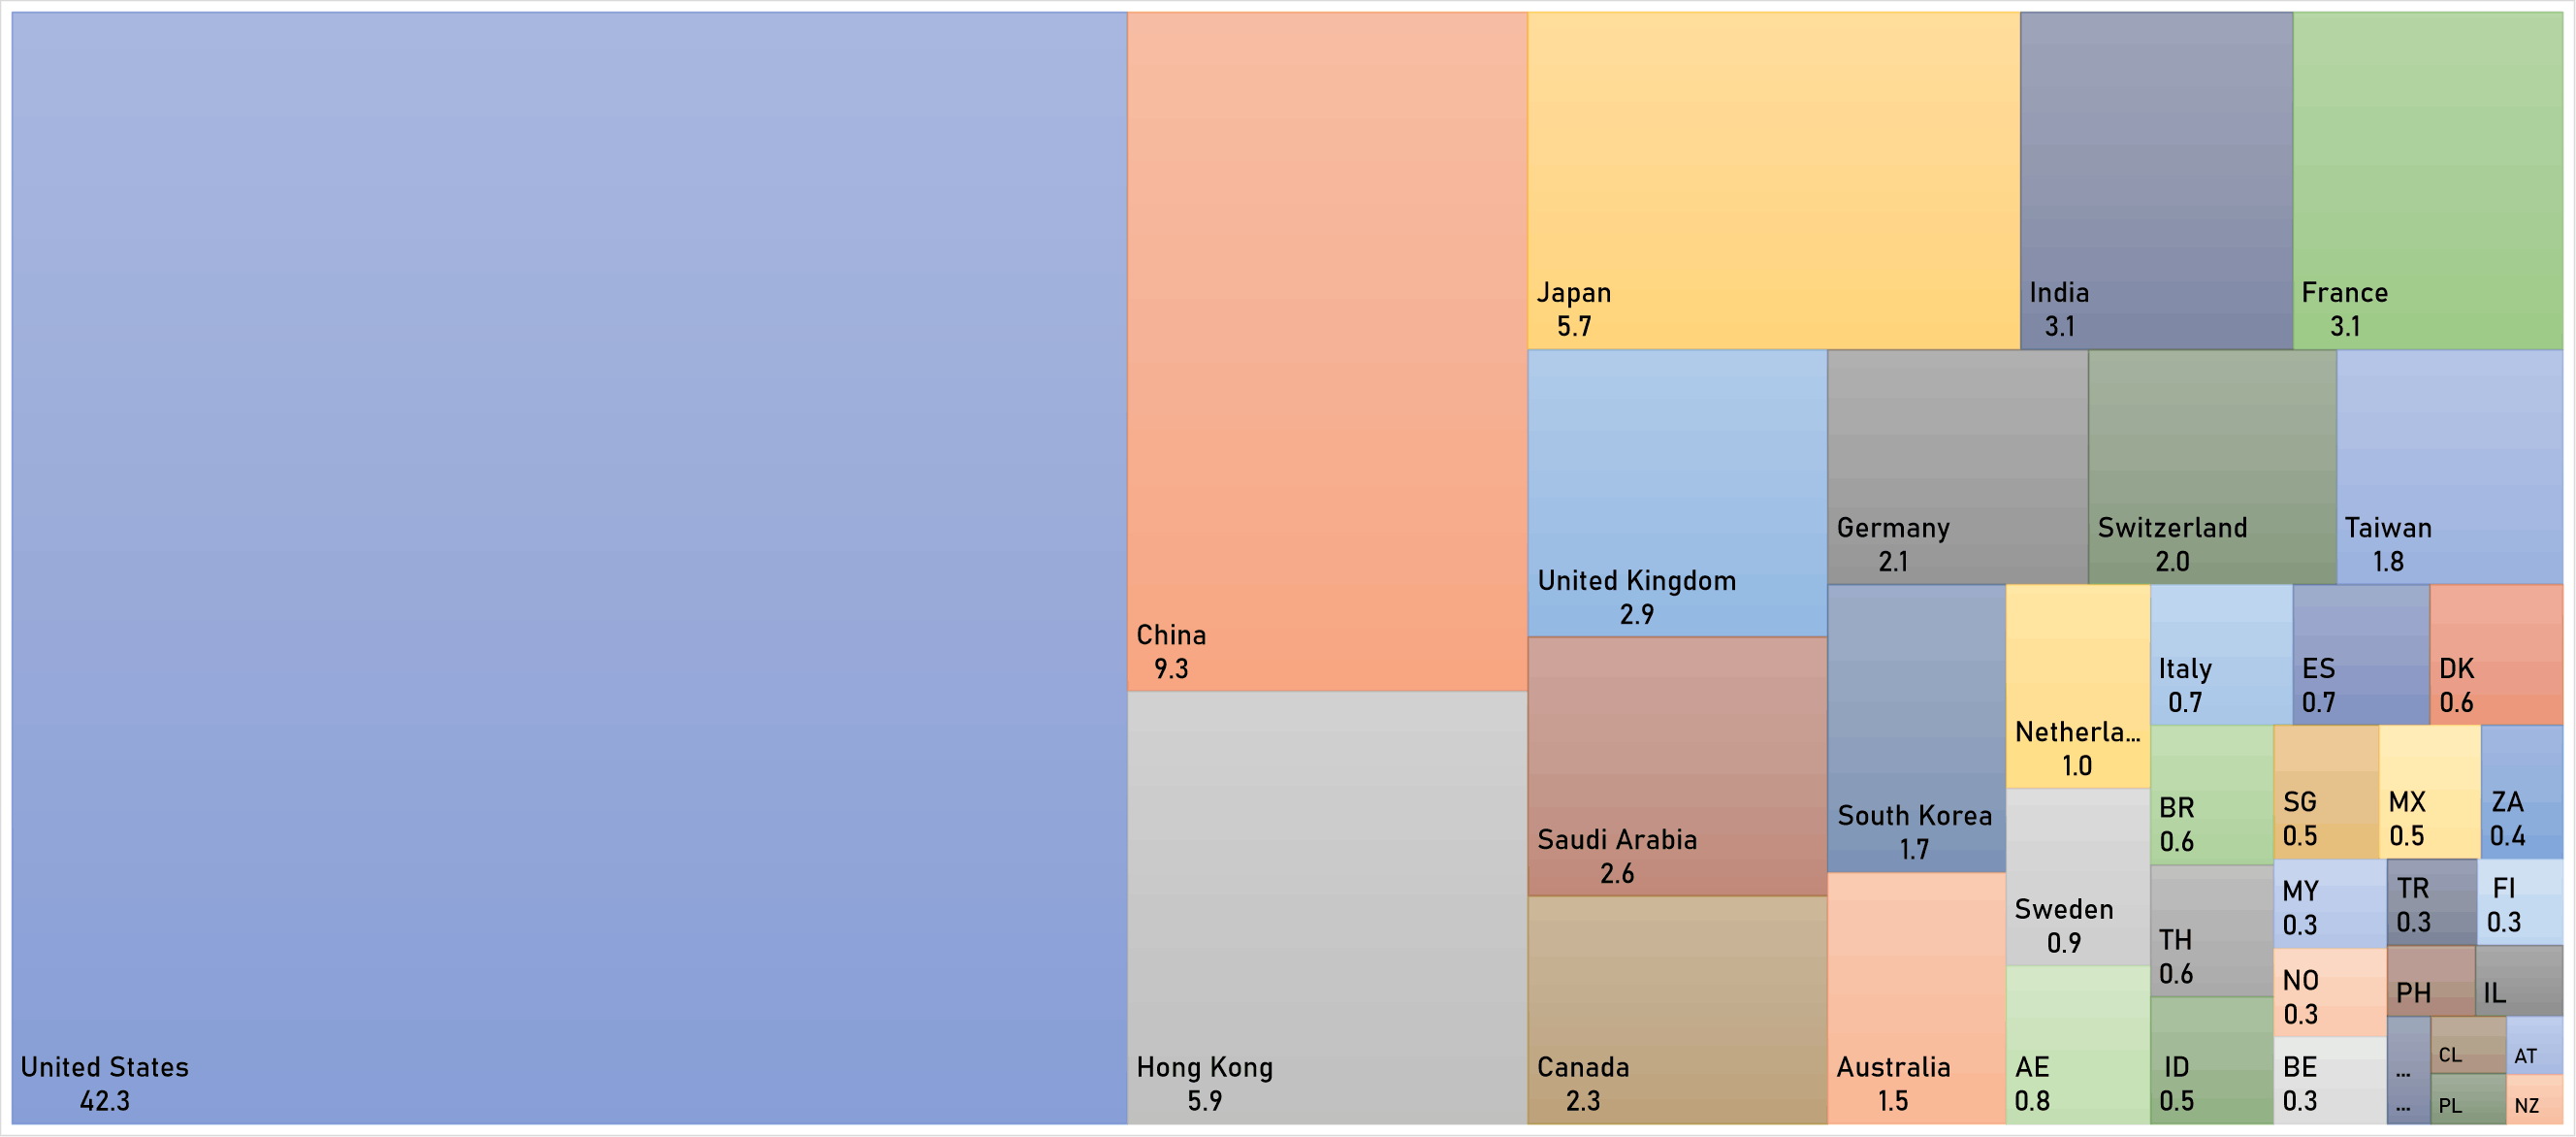
WORLD MARKET CAPITALIZATION (US$ Trillion)