Equities
4% of S&P 500 Companies Will Report 1Q23 Numbers In The Week Ahead, With EPS Expected To Fall 7% YoY
The compartmentalization of market risks has led to huge differences between the implied volatility of stocks compared to rates: 1Y into 2Y USD OIS swaptions are still around 3 standard deviations richer than 1Y ATM options on the S&P 500
Published ET
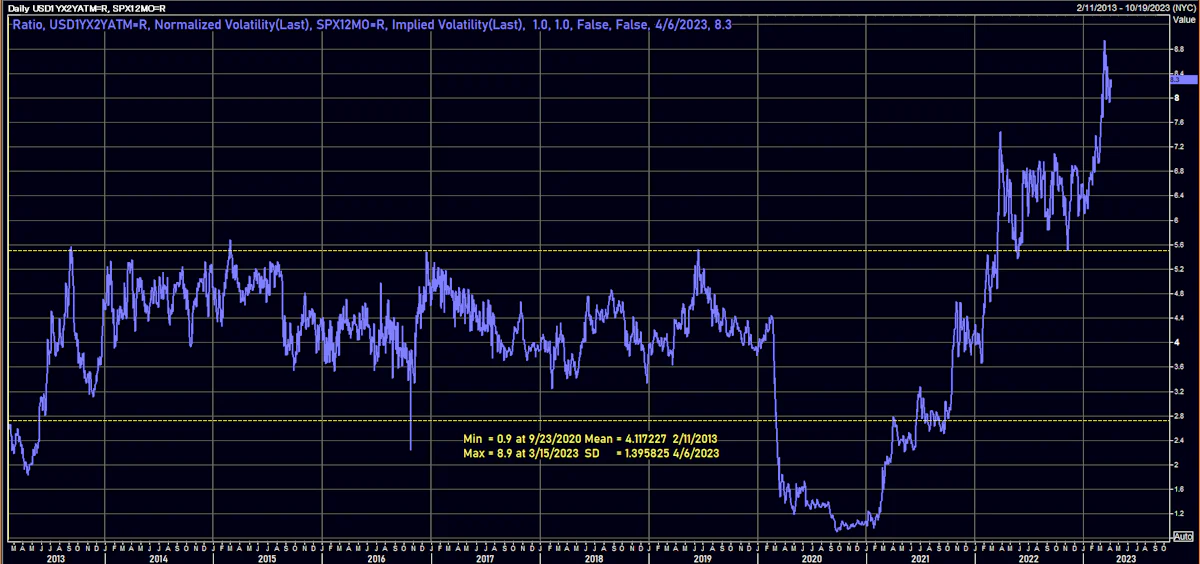
Ratio of Rates To Equities Volatility | Source: Refinitiv
DAILY SUMMARY
- Daily performance of US indices: S&P 500 up 0.36%; Nasdaq Composite up 0.76%; Wilshire 5000 up 0.04%
- 53.5% of S&P 500 stocks were up today, with 53.5% of stocks above their 200-day moving average (DMA) and 42.5% above their 50-DMA
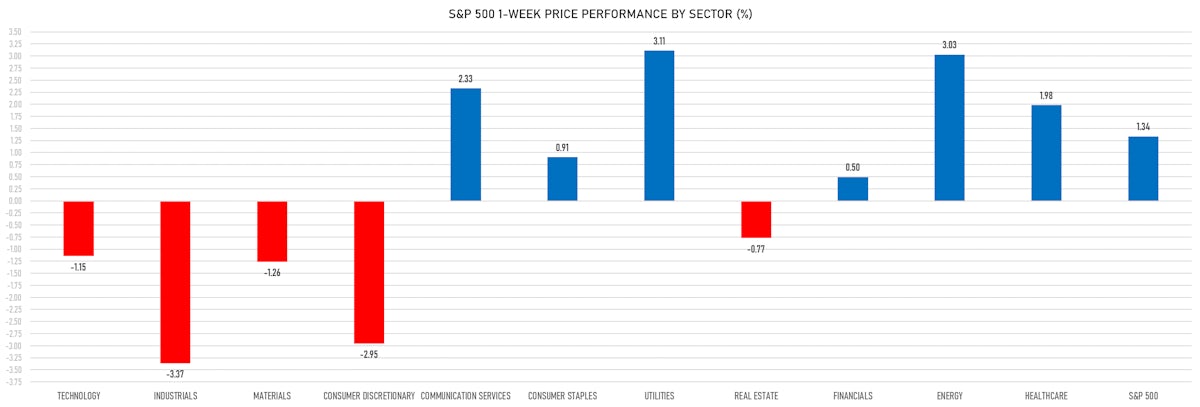
- Top performing sectors in the S&P 500: communication services up 1.71% and utilities up 0.74%
- Bottom performing sectors in the S&P 500: energy down -1.47% and materials down -0.22%
- The number of shares in the S&P 500 traded today was 567m for a total turnover of US$ 56 bn
- The S&P 500 Value Index Index was up 0.3%, while the S&P 500 Growth Index Index was up 0.4%; the S&P small caps index was down 0.0% and mid caps were down 0.0%
- The volume on CME's INX (S&P 500 Index) was 2072.5m (3-month z-score: -0.9); the 3-month average volume is 2568.8m and the 12-month range is 903.0 - 5761.3m
- Daily performance of international indices: Europe Stoxx 600 up 0.51%; UK FTSE 100 up 1.03%; Hang Seng SH-SZ-HK 300 Index up 0.36%; Japan's TOPIX 500 up 0.19%
VOLATILITY TODAY
- 3-month at-the-money implied volatility on the S&P 500 at 16.9%
- 3-month at-the-money implied volatility on the STOXX Europe 600 at 14.4%
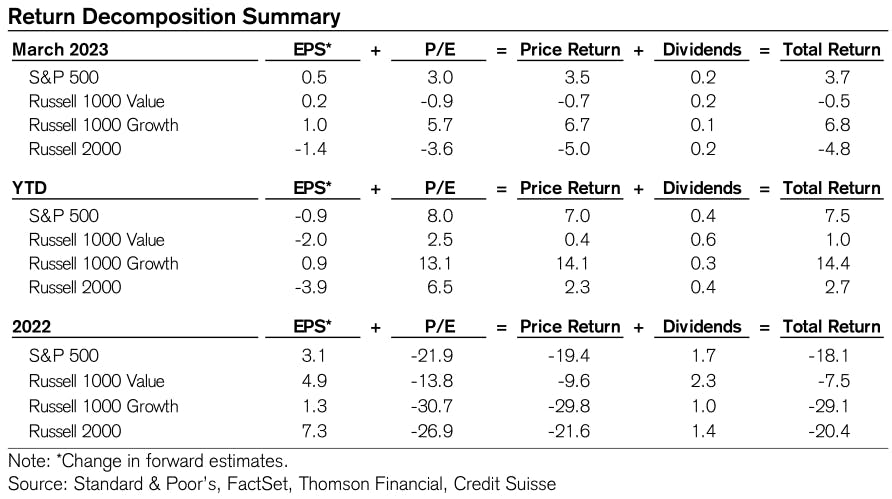
US EQUITIES PERFORMANCE DECOMPOSITION IN 1Q23
NOTABLE US EARNINGS RELEASES IN THE WEEK AHEAD

TOP S&P 500 PERFORMERS THIS WEEK
- UnitedHealth Group Inc (UNH), up 9.1% to $512.81 / YTD price return: -3.3% / 12-Month Price Range: $ 449.90-558.10 / Short interest (% of float): 0.6%; days to cover: 1.6
- Eli Lilly and Co (LLY), up 8.1% to $368.29 / YTD price return: +.7% / 12-Month Price Range: $ 277.10-384.44 / Short interest (% of float): 0.9%; days to cover: 2.3
- Johnson & Johnson (JNJ), up 7.6% to $165.15 / YTD price return: -6.5% / 12-Month Price Range: $ 150.14-186.69
- Marathon Oil Corp (MRO), up 7.6% to $25.52 / YTD price return: -5.7% / 12-Month Price Range: $ 19.42-33.42
- ServiceNow Inc (NOW), up 7.6% to $473.13 / YTD price return: +21.9% / 12-Month Price Range: $ 337.22-542.82 / Short interest (% of float): 1.7%; days to cover: 2.4
- APA Corp (US) (APA), up 7.6% to $38.07 / YTD price return: -18.4% / 12-Month Price Range: $ 30.15-51.95 / Short interest (% of float): 3.8%; days to cover: 2.0
- Alphabet Inc (GOOG), up 7.5% to $108.90 / YTD price return: +22.7% / 12-Month Price Range: $ 83.46-139.85 / Short interest (% of float): 0.6%; days to cover: 0.9
- Alphabet Inc (GOOGL), up 7.5% to $108.42 / YTD price return: +22.9% / 12-Month Price Range: $ 83.34-139.36 / Short interest (% of float): 0.7%; days to cover: 1.0
- Moderna Inc (MRNA), up 7.3% to $158.27 / YTD price return: -11.9% / 12-Month Price Range: $ 115.06-217.20 / Short interest (% of float): 4.6%; days to cover: 4.3
- Molina Healthcare Inc (MOH), up 7.3% to $285.57 / YTD price return: -13.5% / 12-Month Price Range: $ 250.38-374.00 / Short interest (% of float): 2.0%; days to cover: 2.2
BOTTOM S&P 500 PERFORMERS THIS WEEK
- Albemarle Corp (ALB), down 12.5% to $194.68 / YTD price return: -10.2% / 12-Month Price Range: $ 185.15-334.25 / Short interest (% of float): 4.7%; days to cover: 3.1
- Marketaxess Holdings Inc (MKTX), down 11.5% to $343.29 / YTD price return: +23.1% / 12-Month Price Range: $ 217.97-398.91 / Short interest (% of float): 2.7%; days to cover: 3.1
- Generac Holdings Inc (GNRC), down 10.9% to $99.80 / YTD price return: -.9% / 12-Month Price Range: $ 86.33-308.76 / Short interest (% of float): 8.8%; days to cover: 3.8
- Deere & Co (DE), down 8.4% to $369.65 / YTD price return: -13.8% / 12-Month Price Range: $ 283.95-448.31 / Short interest (% of float): 0.9%; days to cover: 1.7
- United Rentals Inc (URI), down 8.0% to $355.27 / YTD price return: .0% / 12-Month Price Range: $ 230.73-481.66 / Short interest (% of float): 4.5%; days to cover: 3.9
- ON Semiconductor Corp (ON), down 7.9% to $75.34 / YTD price return: +20.8% / 12-Month Price Range: $ 44.77-87.52 / Short interest (% of float): 6.3%; days to cover: 3.3
- Eaton Corporation PLC (ETN), down 7.6% to $156.25 / YTD price return: -.4% / 12-Month Price Range: $ 122.50-178.70 / Short interest (% of float): 1.3%; days to cover: 2.6
- Carrier Global Corp (CARR), down 7.3% to $41.80 / YTD price return: +1.3% / 12-Month Price Range: $ 33.12-49.16 / Short interest (% of float): 1.5%; days to cover: 2.5
- Micron Technology Inc (MU), down 7.2% to $58.56 / YTD price return: +17.2% / 12-Month Price Range: $ 48.43-76.22 / Short interest (% of float): 1.9%; days to cover: 1.7
- Parker-Hannifin Corp (PH), down 7.2% to $312.47 / YTD price return: +7.4% / 12-Month Price Range: $ 230.98-364.42 / Short interest (% of float): 1.4%; days to cover: 1.7
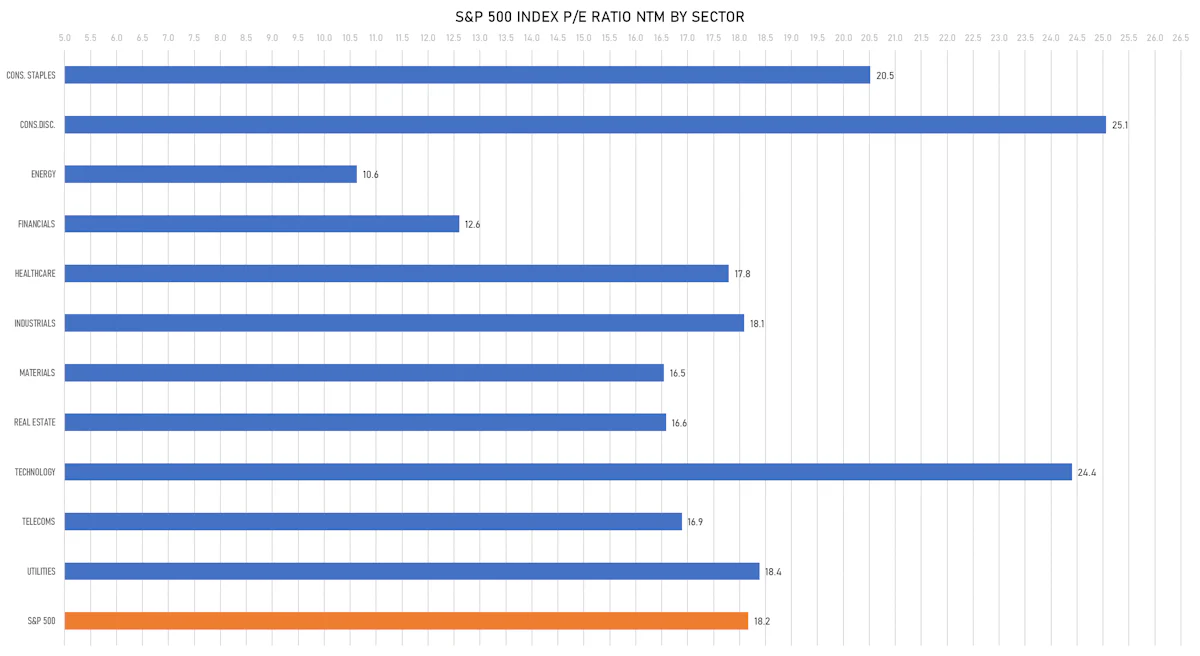
VALUATION MULTIPLES BY SECTORS
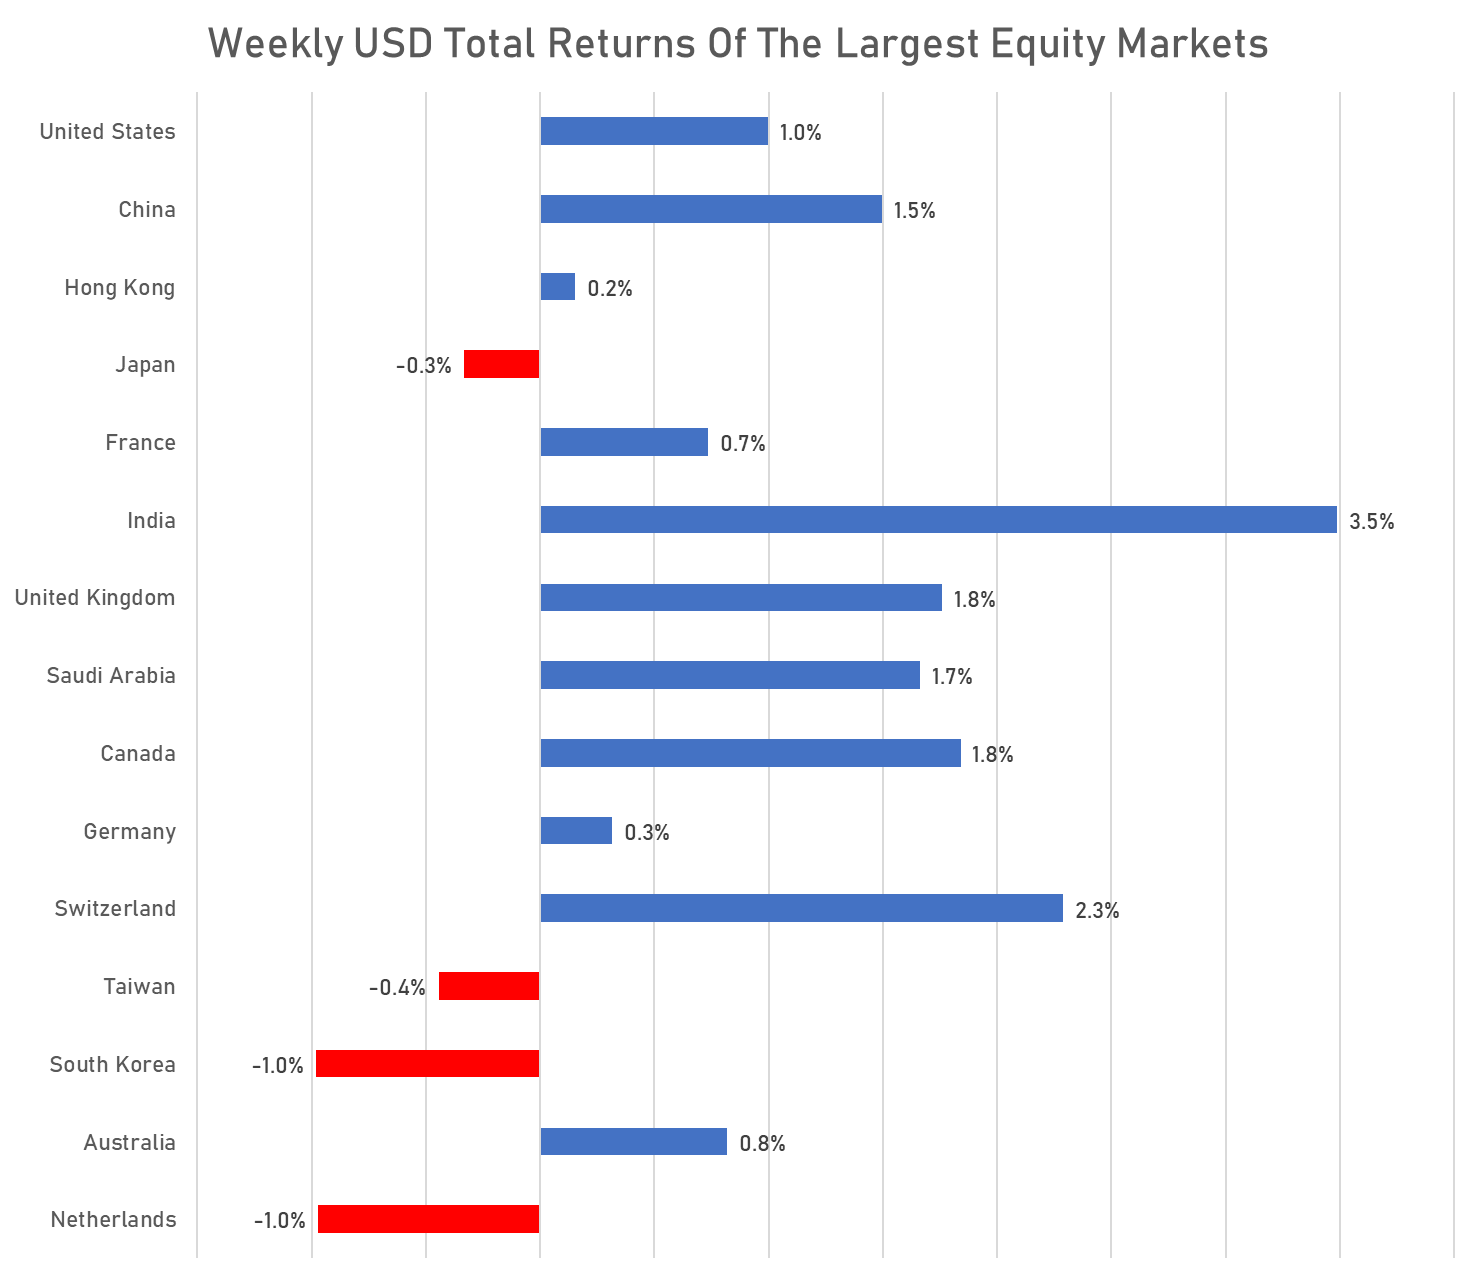
WEEKLY TOTAL RETURNS OF MAJOR GLOBAL EQUITY MARKETS
TOP / BOTTOM PERFORMING WORLD MARKETS YTD

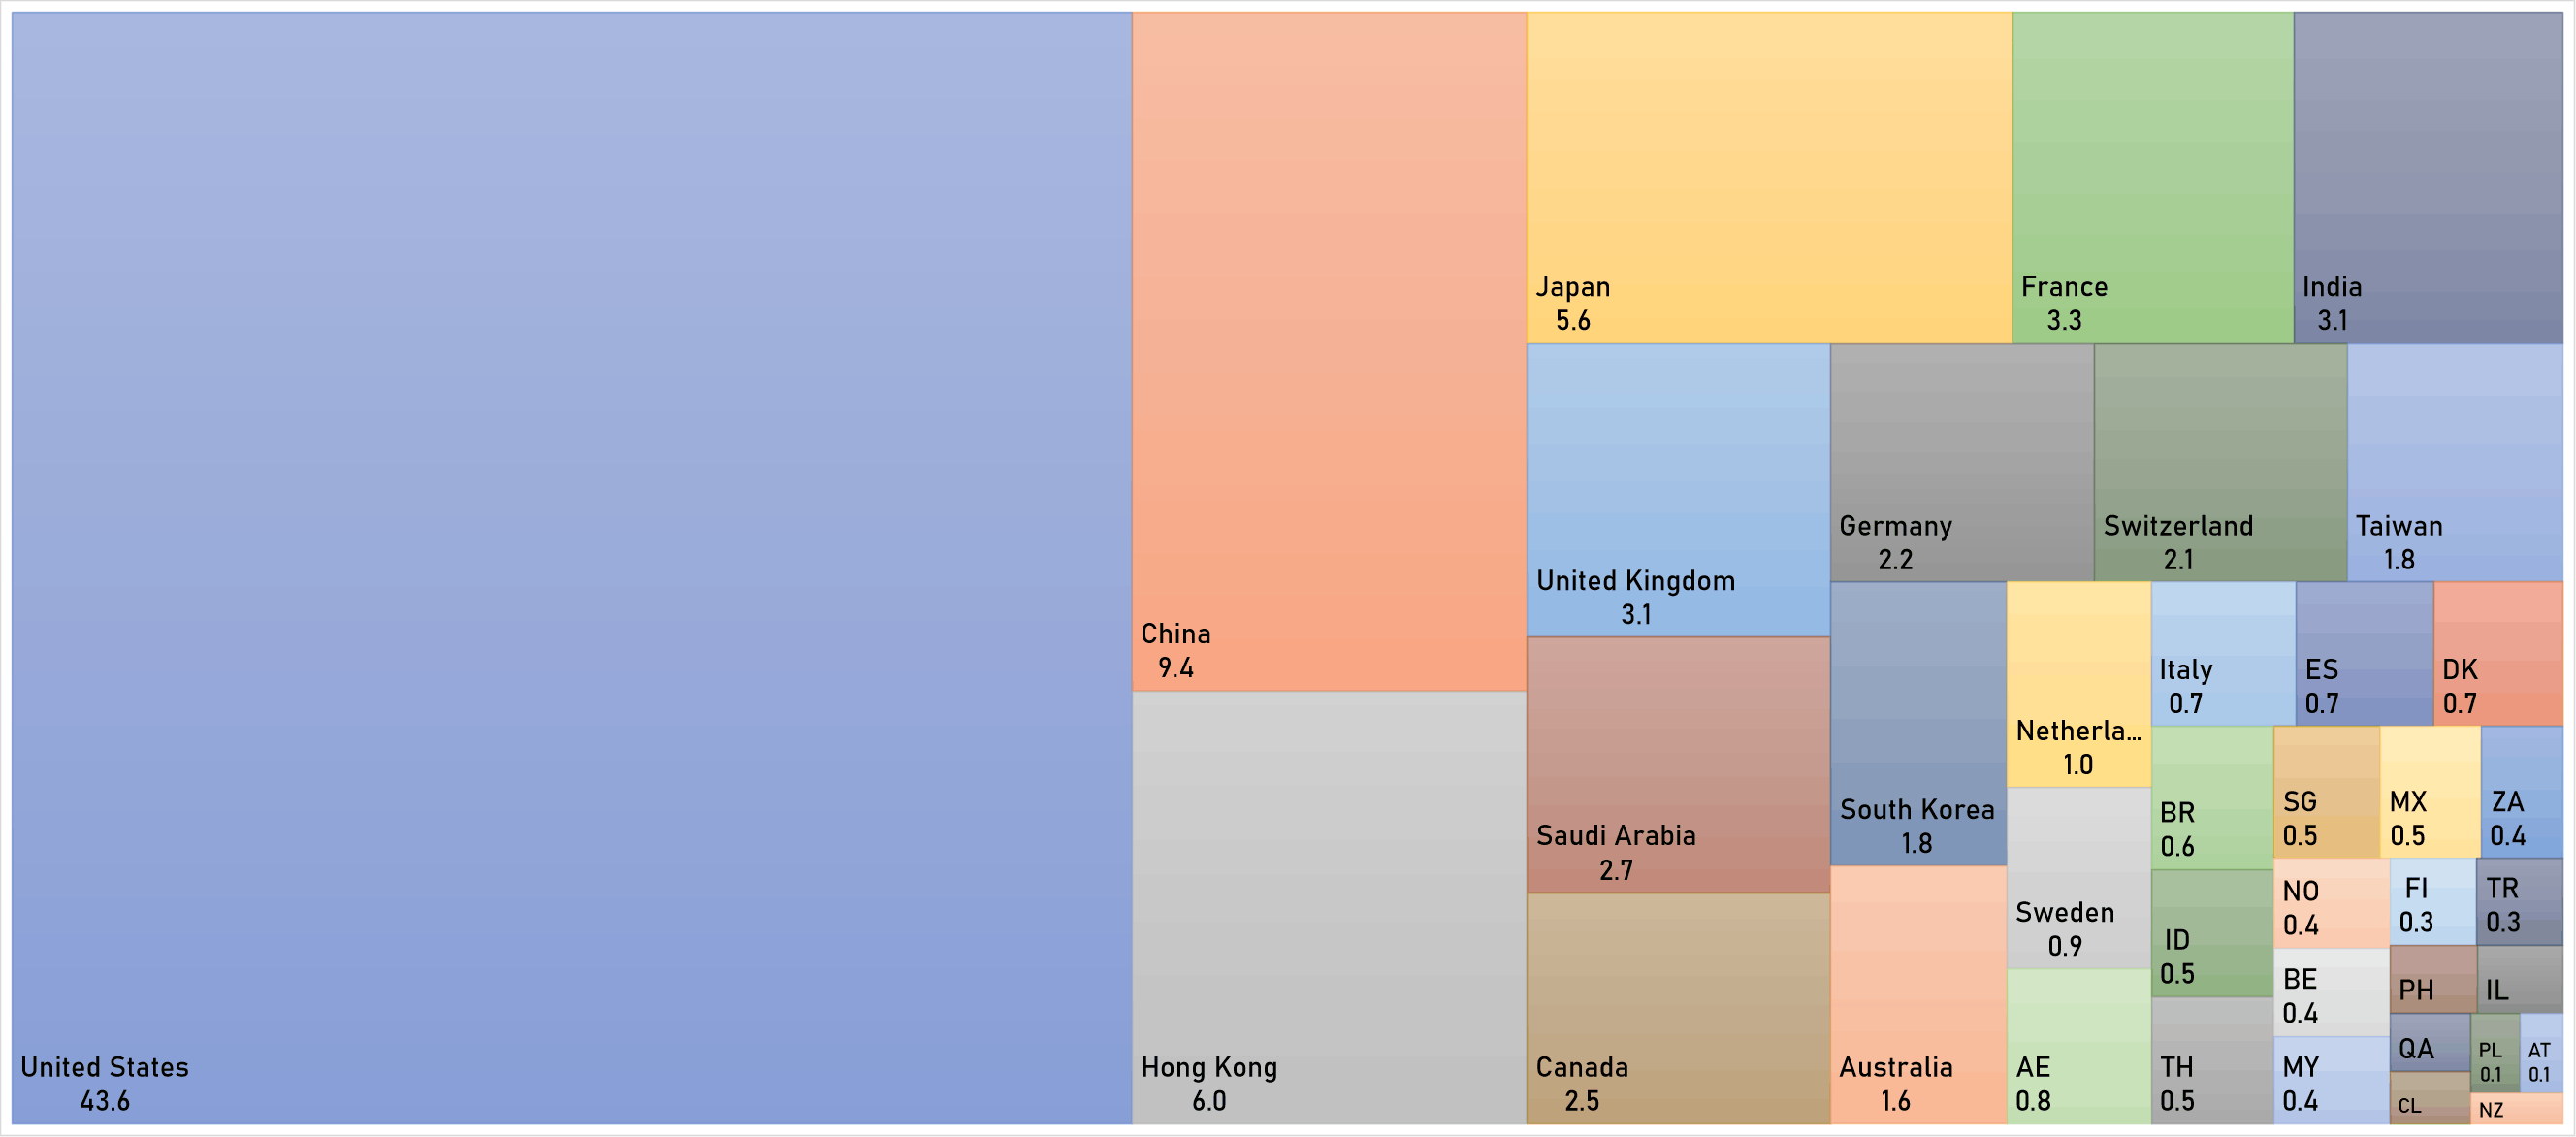
WORLD MARKET CAPITALIZATION (US$ Trillion)