Equities
US Equities Unchanged This Week On String Of Low Volume, Low Volatility Sessions
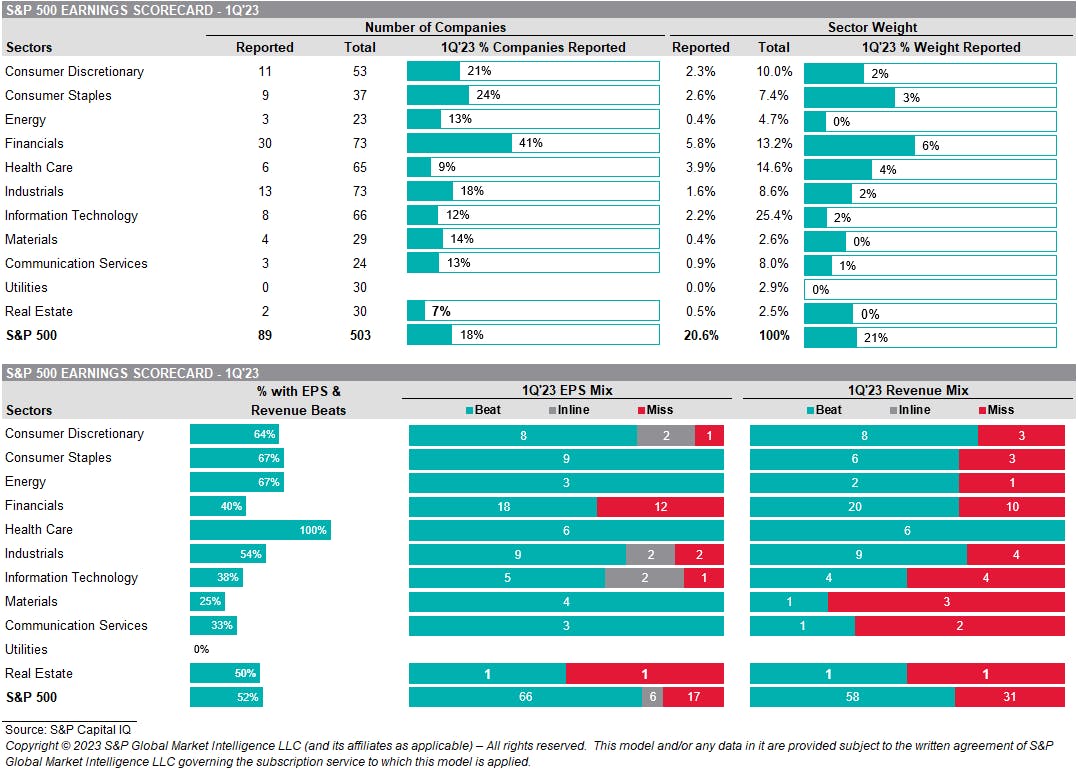
1Q23 earnings so far are slightly better than expected, though still bad: the blended quarterly decline currently at -6.2%, with 53% of companies beating consensus estimates by at least 1 standard deviation (vs 25-year average of 48%)
Published ET
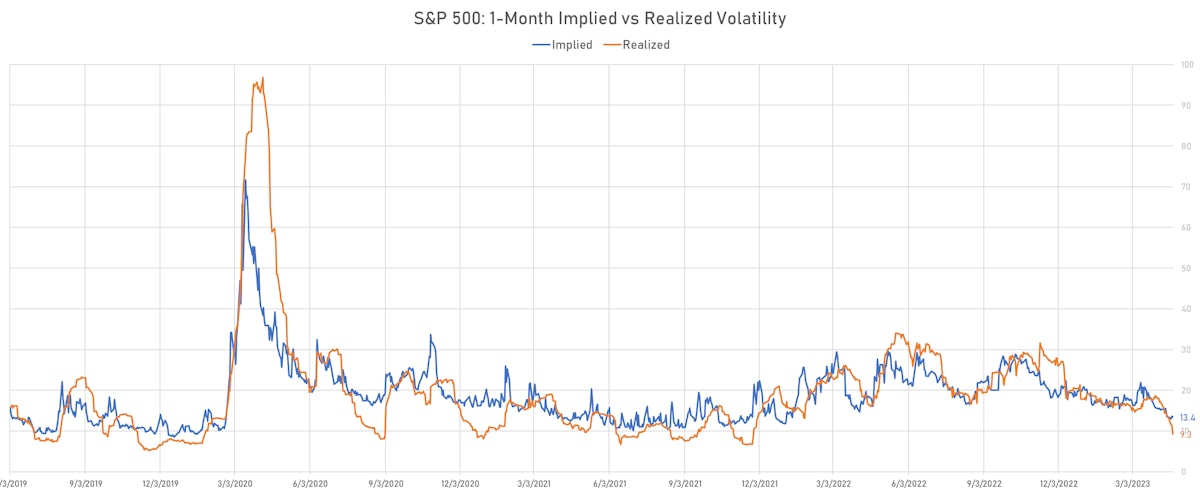
S&P 500 1-Month ATM Implied vs. Realized Volatility | Sources: phipost.com, Refinitiv data
DAILY SUMMARY
- Daily performance of US indices: S&P 500 up 0.09%; Nasdaq Composite up 0.11%; Wilshire 5000 down -0.08%
- 52.3% of S&P 500 stocks were up today, with 56.5% of stocks above their 200-day moving average (DMA) and 55.5% above their 50-DMA
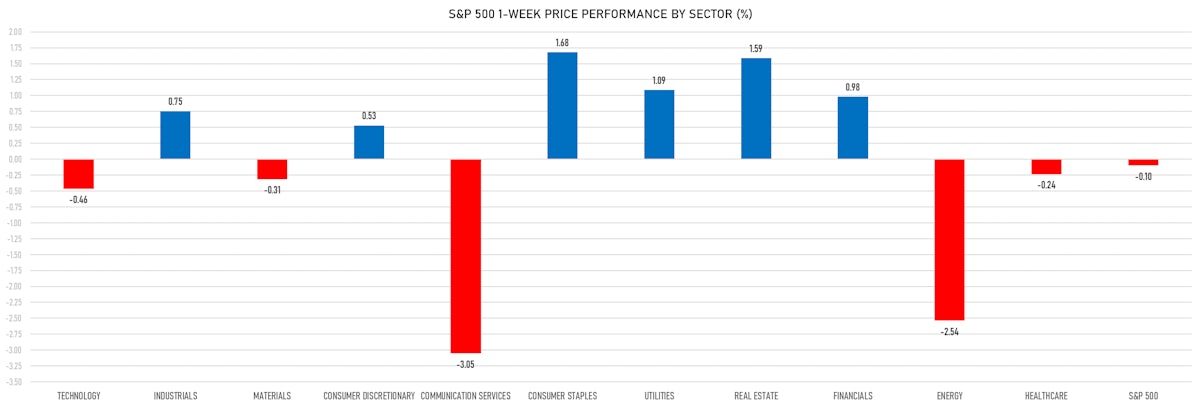
- Top performing sectors in the S&P 500: consumer discretionary up 1.20% and consumer staples up 0.75%
- Bottom performing sectors in the S&P 500: materials down -0.91% and energy down -0.59%
- The number of shares in the S&P 500 traded today was 674m for a total turnover of US$ 64 bn
- The S&P 500 Value Index Index was up 0.2%, while the S&P 500 Growth Index Index was up 0.0%; the S&P small caps index was down -0.3% and mid caps were down -0.2%
- The volume on CME's INX (S&P 500 Index) was 2304.1m (3-month z-score: -0.4); the 3-month average volume is 2531.6m and the 12-month range is 903.0 - 5761.3m
- Daily performance of international indices: Europe Stoxx 600 up 0.34%; UK FTSE 100 up 0.15%; Hang Seng SH-SZ-HK 300 Index down -1.92%; Japan's TOPIX 500 down -0.25%
VOLATILITY TODAY
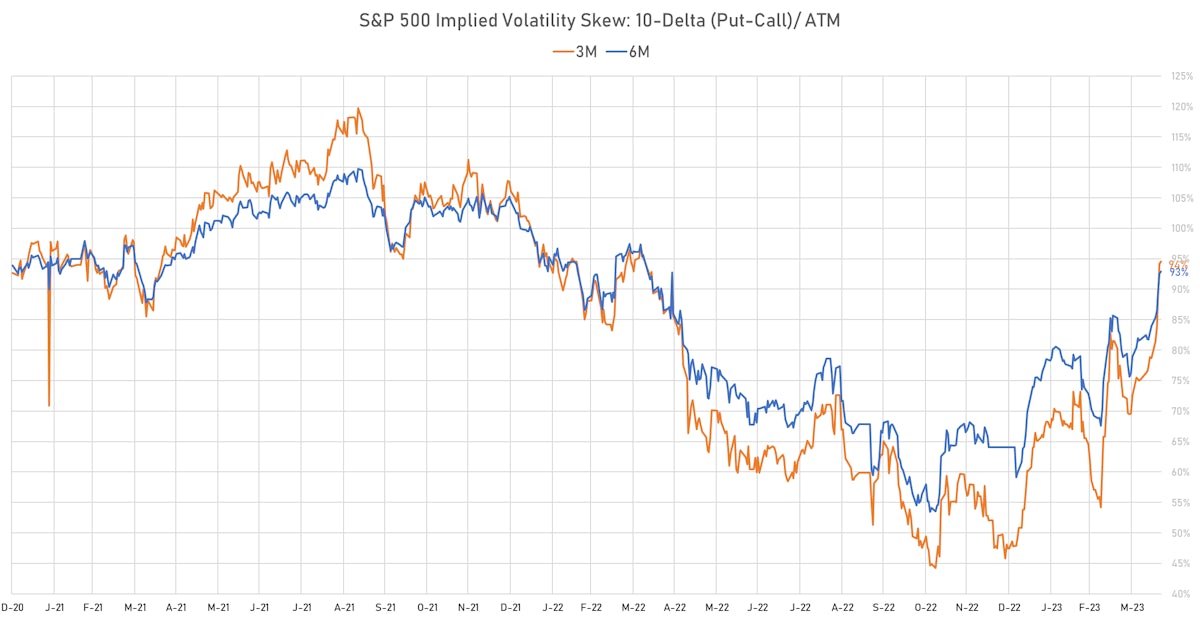
- 3-month at-the-money implied volatility on the S&P 500 at 13.4%, down from 13.6%; implied vols are even more heavily skewed to the downside than last week (contrarian indicator though volumes are light)
- 3-month at-the-money implied volatility on the STOXX Europe 600 at 11.2%, down from 12.3%
TOP WINNERS TODAY
- EyePoint Pharmaceuticals Inc (EYPT), up 58.5% to $9.00 / YTD price return: +157.1% / 12-Month Price Range: $ 2.19-12.65 / Short interest (% of float): 10.9%; days to cover: 11.1
- CBL International Ltd (BANL), up 34.8% to $17.41 / 12-Month Price Range: $ 4.17-20.94 / Short interest (% of float): 1.4%; days to cover: 0.1
- Icosavax Inc (ICVX), up 23.8% to $6.06 / YTD price return: -23.7% / 12-Month Price Range: $ 2.28-16.45 / Short interest (% of float): 5.4%; days to cover: 13.3
- Tenaya Therapeutics Inc (TNYA), up 22.8% to $5.55 / YTD price return: +176.1% / 12-Month Price Range: $ 1.64-11.32 / Short interest (% of float): 2.6%; days to cover: 4.5
- Mullen Automotive Inc (MULN), up 21.5% to $0.10 / YTD price return: -64.0% / 12-Month Price Range: $ 0.08-1.71 / Short interest (% of float): 7.7%; days to cover: 1.0
- Immunitybio Inc (IBRX), up 17.0% to $2.68 / YTD price return: -47.1% / 12-Month Price Range: $ 1.21-7.80 / Short interest (% of float): 22.5%; days to cover: 5.4
- Community Health Systems Inc (CYH), up 15.7% to $5.90 / YTD price return: +36.6% / 12-Month Price Range: $ 1.88-12.12
- EverCommerce Inc (EVCM), up 15.4% to $13.01 / YTD price return: +74.9% / 12-Month Price Range: $ 5.87-13.88 / Short interest (% of float): 1.2%; days to cover: 5.0
- VectivBio Holding AG (VECT), up 14.5% to $10.88 / YTD price return: +25.6% / 12-Month Price Range: $ 3.81-10.88 / Short interest (% of float): 0.2%; days to cover: 6.1
- Nexters Inc (GDEV), up 13.5% to $5.70 / YTD price return: -10.7% / 12-Month Price Range: $ 3.10-8.10 / Short interest (% of float): 0.9%; days to cover: 18.9
BIGGEST LOSERS TODAY
- U Power Ltd (UCAR), down 81.9% to $7.83 / 12-Month Price Range: $ 7.83-75.00 (the stock is currently on the short sale restriction list)
- Peakstone Realty Trust (PKST), down 21.2% to $29.00 / 12-Month Price Range: $ 8.00-47.00 (the stock is currently on the short sale restriction list)
- Sociedad Quimica y Minera de Chile SA (SQM), down 18.6% to $63.44 / YTD price return: -20.5% / 12-Month Price Range: $ 63.44-115.76 / Short interest (% of float): 2.9%; days to cover: 2.1 (the stock is currently on the short sale restriction list)
- Scilex Holding Co (SCLX), down 16.0% to $10.27 / YTD price return: +157.4% / 12-Month Price Range: $ 2.87-16.90 / Short interest (% of float): 1.4%; days to cover: 4.7 (the stock is currently on the short sale restriction list)
- 374Water Inc (SCWO), down 13.4% to $3.17 / YTD price return: +10.8% / 12-Month Price Range: $ 1.76-5.17 / Short interest (% of float): 2.0%; days to cover: 4.2 (the stock is currently on the short sale restriction list)
- Intuitive Machines Inc (LUNR), down 12.7% to $8.81 / YTD price return: -11.9% / 12-Month Price Range: $ 8.55-136.00 / Short interest (% of float): 0.5%; days to cover: 0.2 (the stock is currently on the short sale restriction list)
- Asure Software Inc (ASUR), down 12.4% to $14.62 / YTD price return: +56.5% / 12-Month Price Range: $ 4.87-17.14 / Short interest (% of float): 3.5%; days to cover: 1.8 (the stock is currently on the short sale restriction list)
- Vigil Neuroscience Inc (VIGL), down 10.3% to $8.77 / YTD price return: -29.8% / 12-Month Price Range: $ 2.18-16.77 / Short interest (% of float): 1.4%; days to cover: 22.3 (the stock is currently on the short sale restriction list)
- Alti Global Inc (ALTI), down 10.1% to $7.94 / YTD price return: -27.2% / 12-Month Price Range: $ 5.54-28.49 / Short interest (% of float): 1.8%; days to cover: 3.1 (the stock is currently on the short sale restriction list)
- Albemarle Corp (ALB), down 10.0% to $173.75 / YTD price return: -19.9% / 12-Month Price Range: $ 173.75-334.55 / Short interest (% of float): 5.3%; days to cover: 3.3 (the stock is currently on the short sale restriction list)
1Q23 EARNINGS DASHBOARD
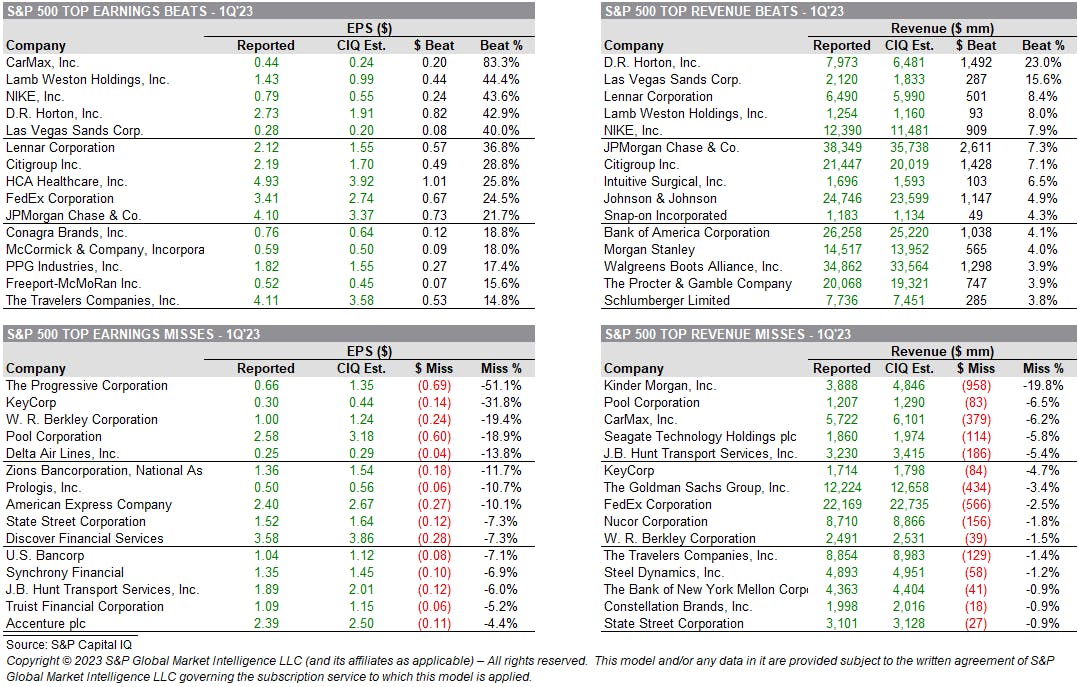
TOP EARNINGS BEATS & MISSES
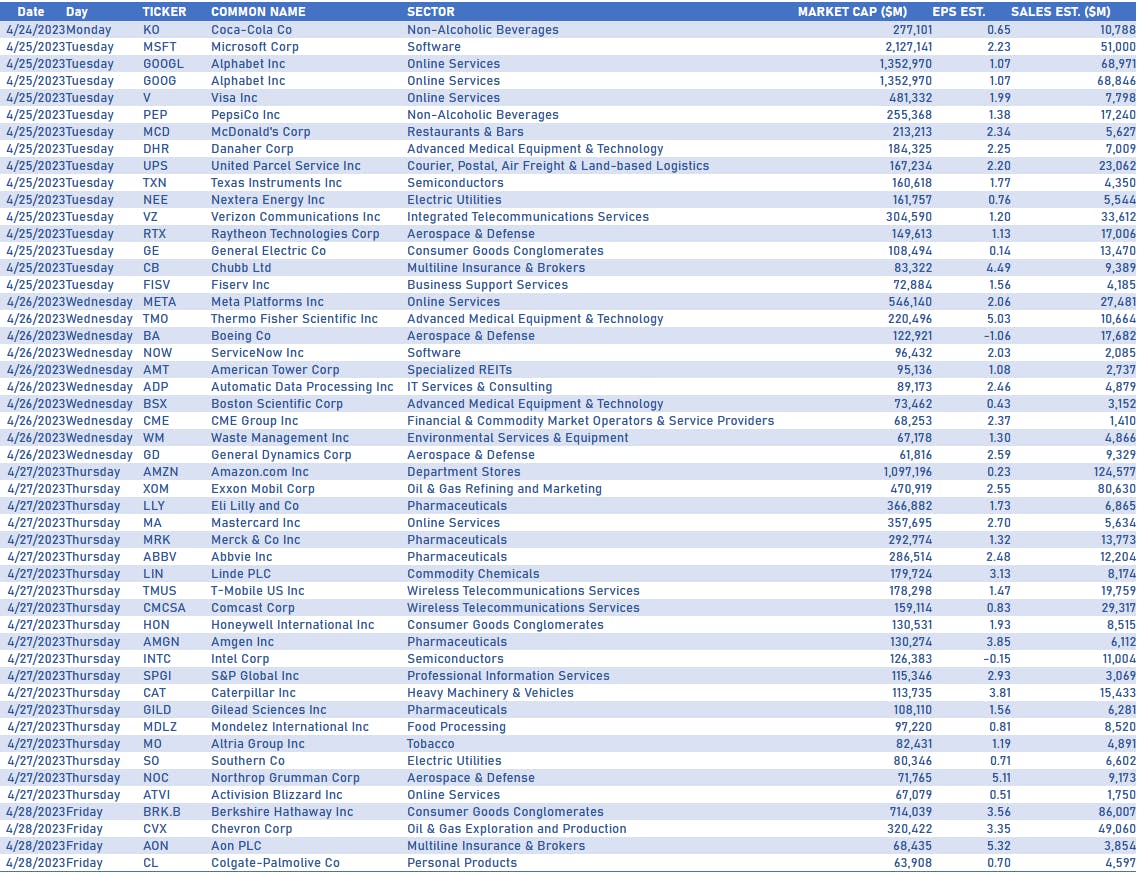
TOP EARNINGS IN THE WEEK AHEAD
TOP S&P 500 PERFORMERS THIS WEEK
- Intuitive Surgical Inc (ISRG), up 12.4% to $300.22 / YTD price return: +13.1% / 12-Month Price Range: $ 180.34-307.70 / Short interest (% of float): 0.7%; days to cover: 1.5
- Snap-On Inc (SNA), up 9.6% to $263.01 / YTD price return: +15.1% / 12-Month Price Range: $ 190.61-263.79 / Short interest (% of float): 4.5%; days to cover: 7.3
- First Republic Bank (FRC), up 8.7% to $14.26 / YTD price return: -88.3% / 12-Month Price Range: $ 11.52-171.02 / Short interest (% of float): 30.1%; days to cover: 0.9
- DR Horton Inc (DHI), up 8.5% to $106.58 / YTD price return: +19.6% / 12-Month Price Range: $ 59.26-110.34 / Short interest (% of float): 3.9%; days to cover: 3.7
- Las Vegas Sands Corp (LVS), up 8.2% to $63.05 / YTD price return: +31.2% / 12-Month Price Range: $ 28.88-63.49 / Short interest (% of float): 4.0%; days to cover: 2.9
- Digital Realty Trust Inc (DLR), up 7.6% to $96.64 / YTD price return: -3.6% / 12-Month Price Range: $ 85.82-152.98 / Short interest (% of float): 4.9%; days to cover: 5.4
- Abbott Laboratories (ABT), up 7.4% to $111.66 / YTD price return: +1.7% / 12-Month Price Range: $ 93.27-124.35 / Short interest (% of float): 0.7%; days to cover: 2.2
- Enphase Energy Inc (ENPH), up 7.0% to $223.61 / YTD price return: -15.6% / 12-Month Price Range: $ 128.68-339.88 / Short interest (% of float): 4.5%; days to cover: 1.7
- Dexcom Inc (DXCM), up 6.9% to $123.73 / YTD price return: +9.3% / 12-Month Price Range: $ 66.94-125.55 / Short interest (% of float): 3.2%; days to cover: 5.3
- United Airlines Holdings Inc (UAL), up 6.7% to $44.45 / YTD price return: +17.9% / 12-Month Price Range: $ 31.58-55.04 / Short interest (% of float): 4.7%; days to cover: 2.0
BOTTOM S&P 500 PERFORMERS THIS WEEK
- Albemarle Corp (ALB), down 14.8% to $173.75 / YTD price return: -19.9% / 12-Month Price Range: $ 173.75-334.25 / Short interest (% of float): 5.3%; days to cover: 3.3 (the stock is currently on the short sale restriction list)
- CDW Corp (CDW), down 12.7% to $163.13 / YTD price return: -8.7% / 12-Month Price Range: $ 148.04-214.96 / Short interest (% of float): 1.2%; days to cover: 2.3
- Seagate Technology Holdings PLC (STX), down 11.8% to $56.42 / YTD price return: +7.2% / 12-Month Price Range: $ 47.47-88.25 / Short interest (% of float): 5.7%; days to cover: 5.1
- Tesla Inc (TSLA), down 10.8% to $165.08 / YTD price return: +34.0% / 12-Month Price Range: $ 101.83-363.50 / Short interest (% of float): 3.1%; days to cover: 0.6
- Moderna Inc (MRNA), down 10.3% to $140.85 / YTD price return: -21.6% / 12-Month Price Range: $ 115.06-217.20 / Short interest (% of float): 4.9%; days to cover: 4.7
- Valero Energy Corp (VLO), down 9.3% to $119.63 / YTD price return: -5.7% / 12-Month Price Range: $ 96.75-150.34 / Short interest (% of float): 2.8%; days to cover: 2.2
- Hewlett Packard Enterprise Co (HPE), down 9.1% to $14.46 / YTD price return: -9.3% / 12-Month Price Range: $ 11.91-17.25 / Short interest (% of float): 2.4%; days to cover: 2.3
- APA Corp (US) (APA), down 8.7% to $37.23 / YTD price return: -20.2% / 12-Month Price Range: $ 30.15-51.95 / Short interest (% of float): 4.0%; days to cover: 1.8
- AT&T Inc (T), down 8.6% to $18.22 / YTD price return: -1.0% / 12-Month Price Range: $ 14.47-21.53 / Short interest (% of float): 1.2%; days to cover: 2.9 (the stock is currently on the short sale restriction list)
- Freeport-McMoRan Inc (FCX), down 8.1% to $39.66 / YTD price return: +4.4% / 12-Month Price Range: $ 24.81-48.42 / Short interest (% of float): 1.2%; days to cover: 1.3
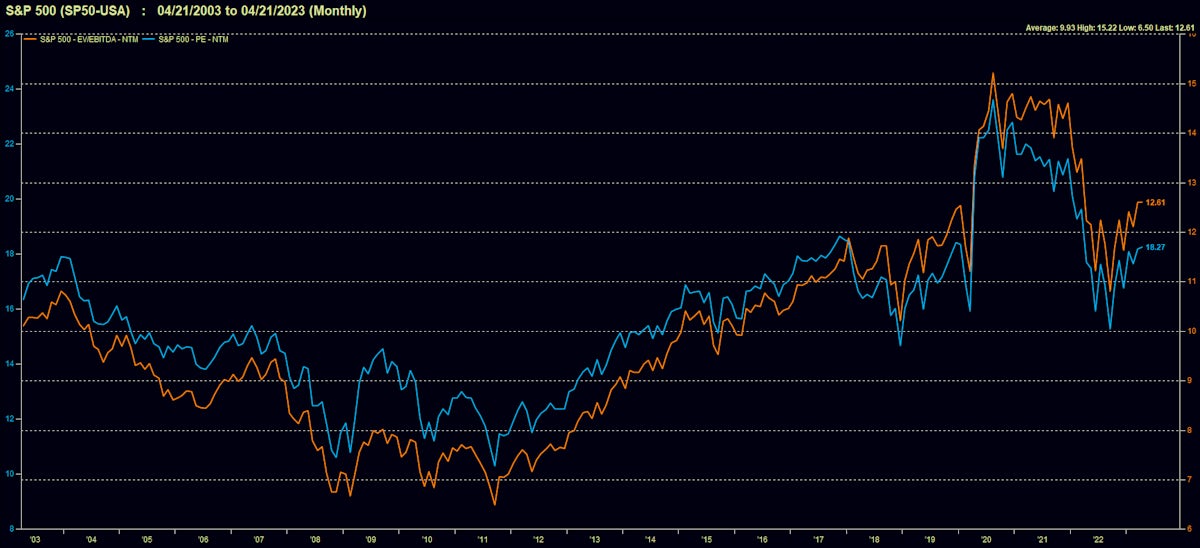
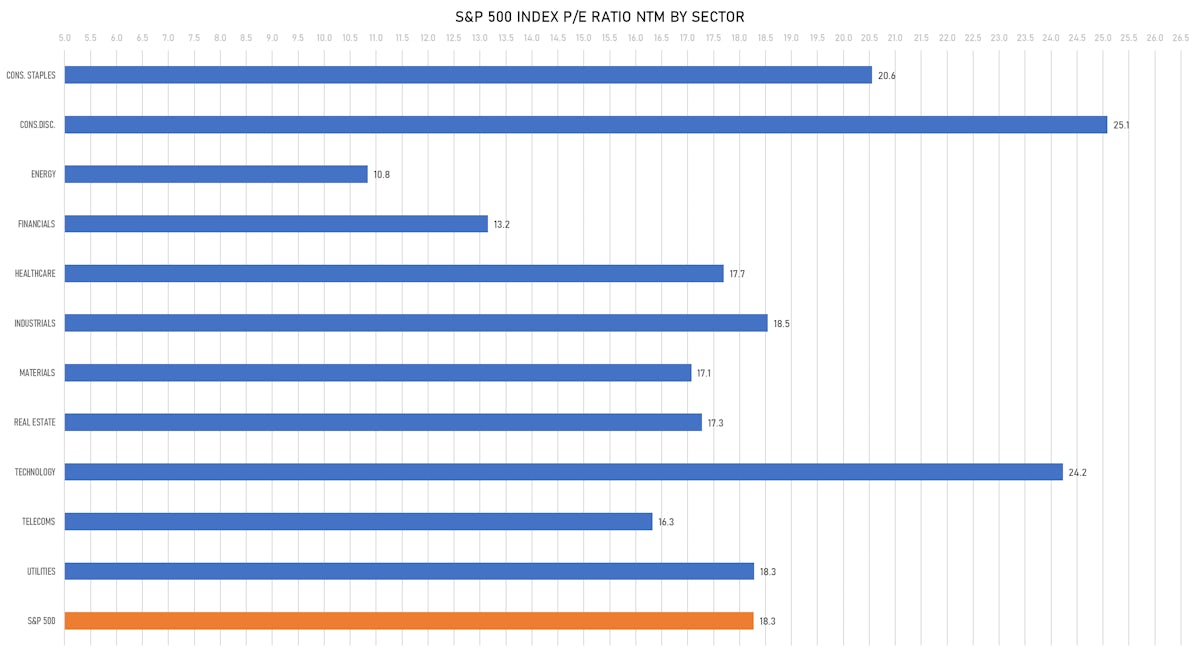
VALUATION MULTIPLES BY SECTORS
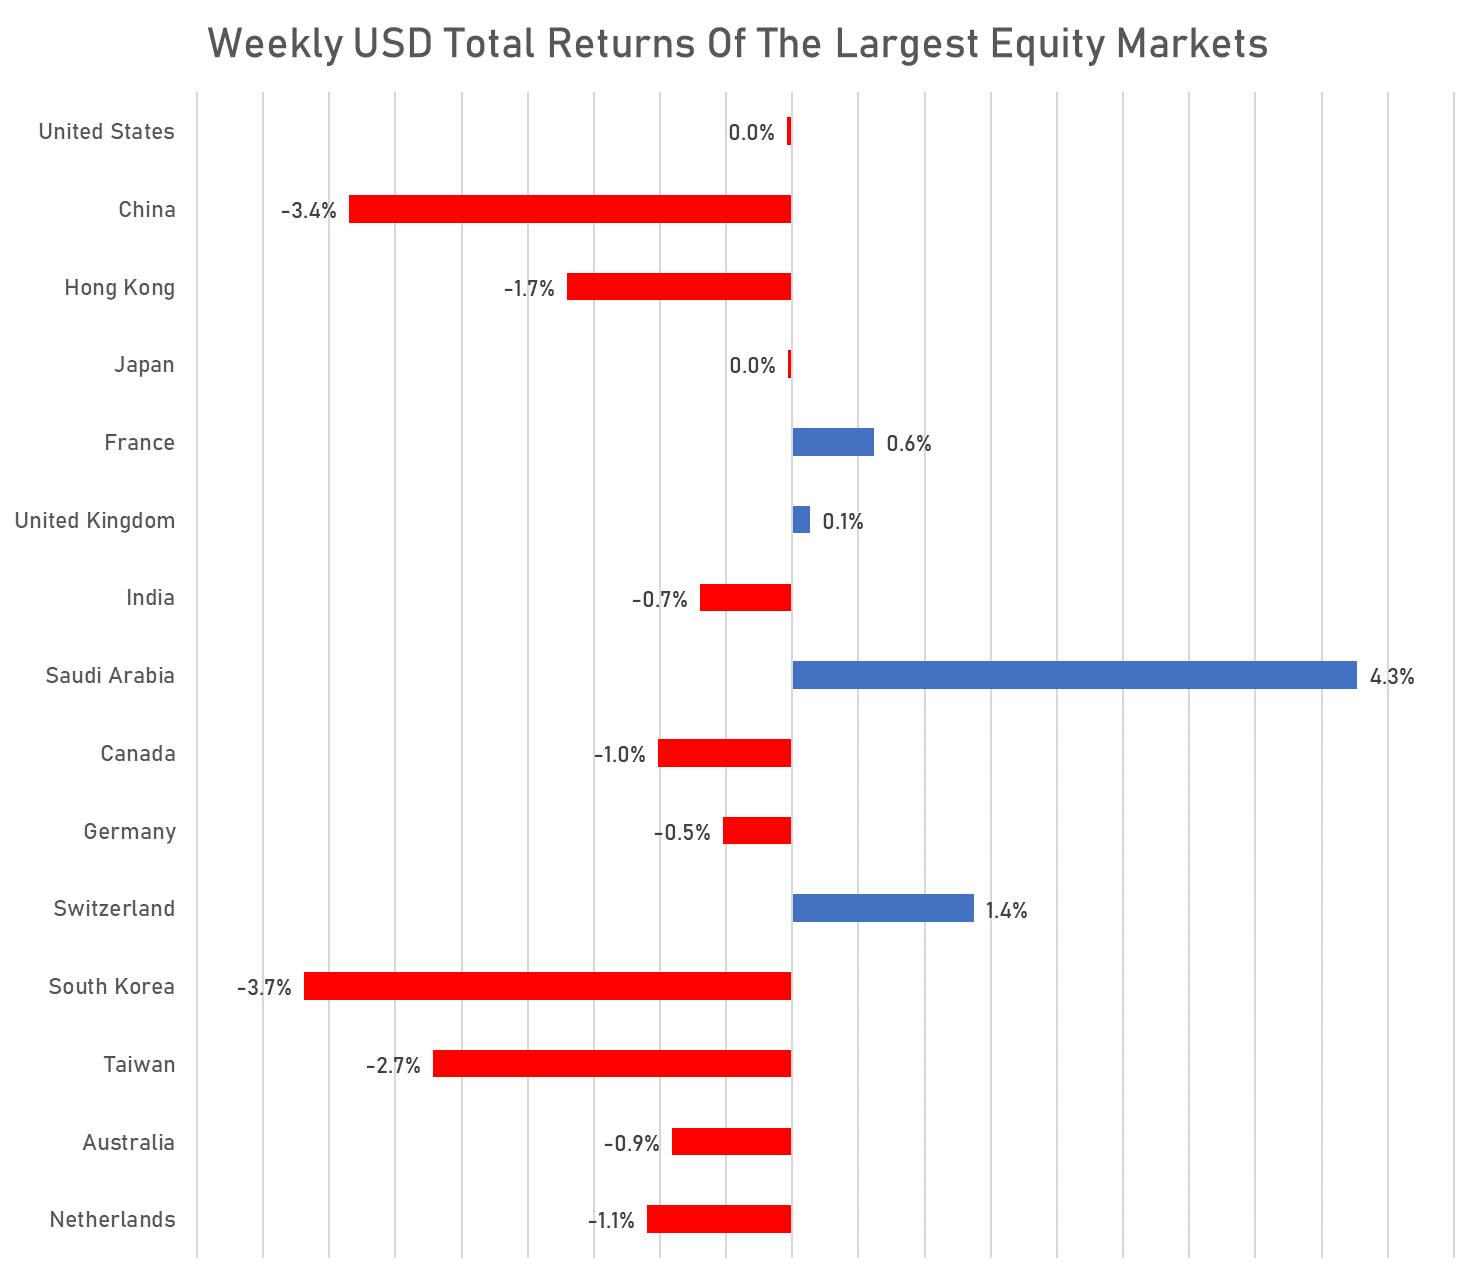
WEEKLY TOTAL RETURNS OF MAJOR GLOBAL EQUITY MARKETS
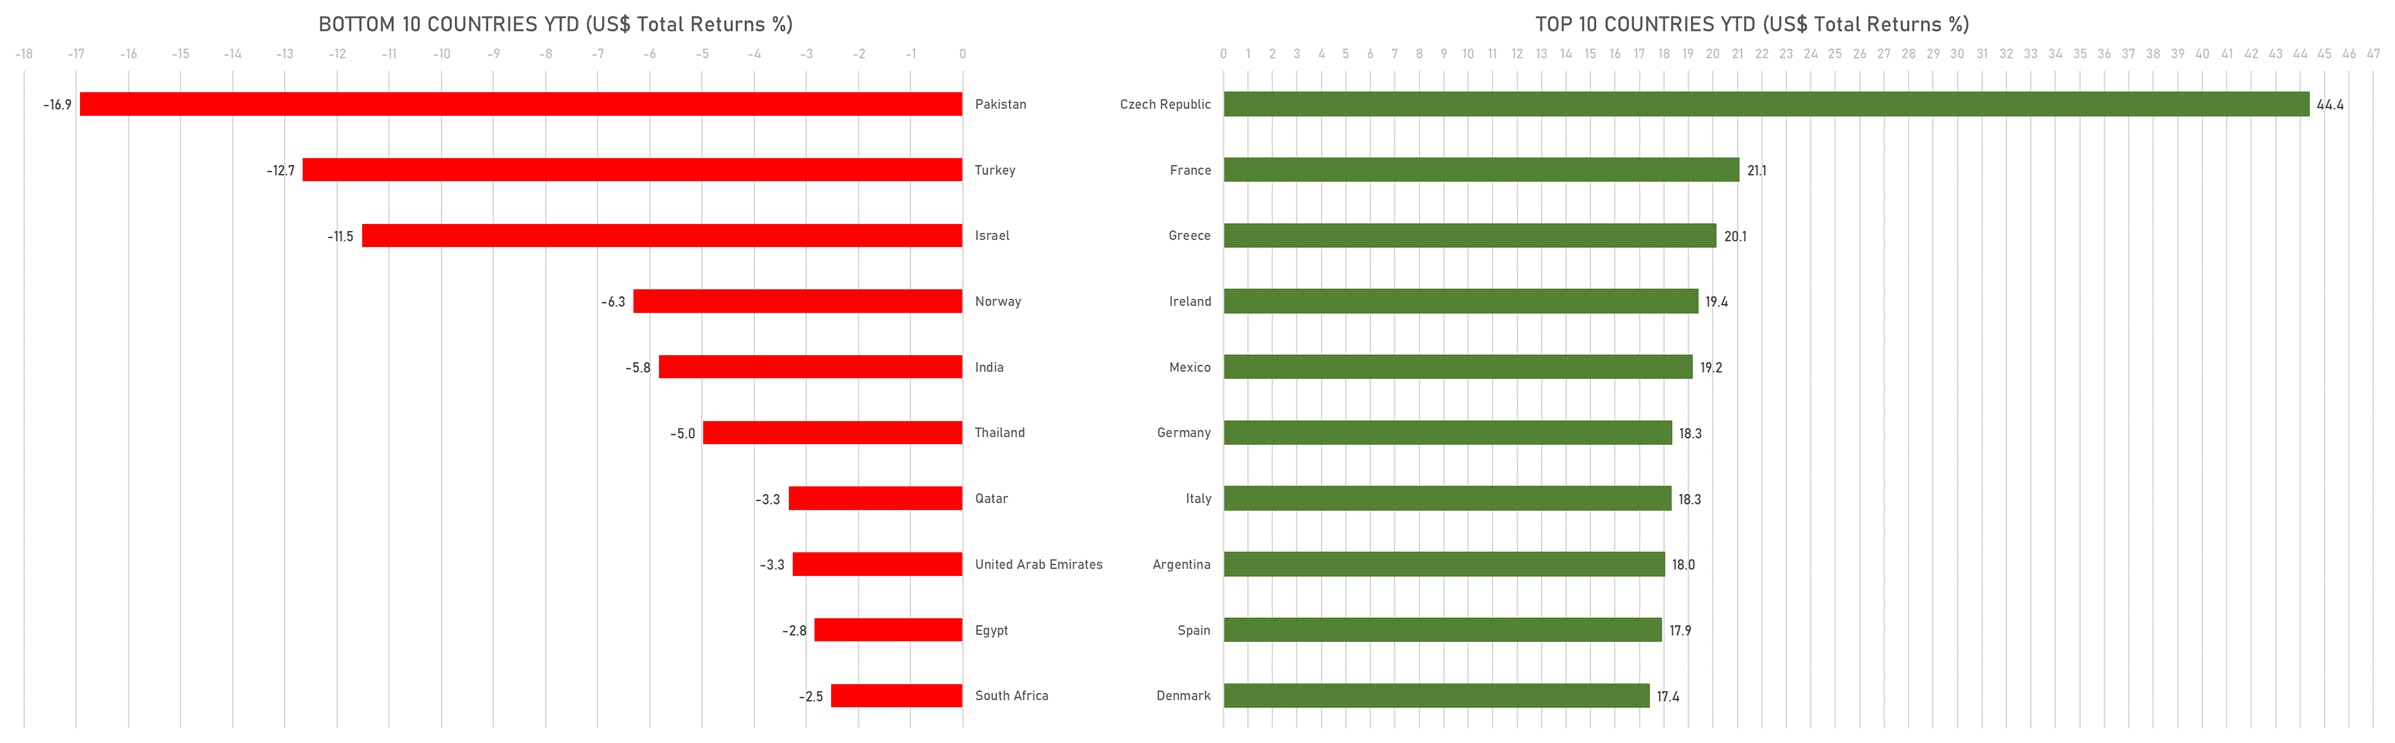
TOP / BOTTOM PERFORMING WORLD MARKETS YTD
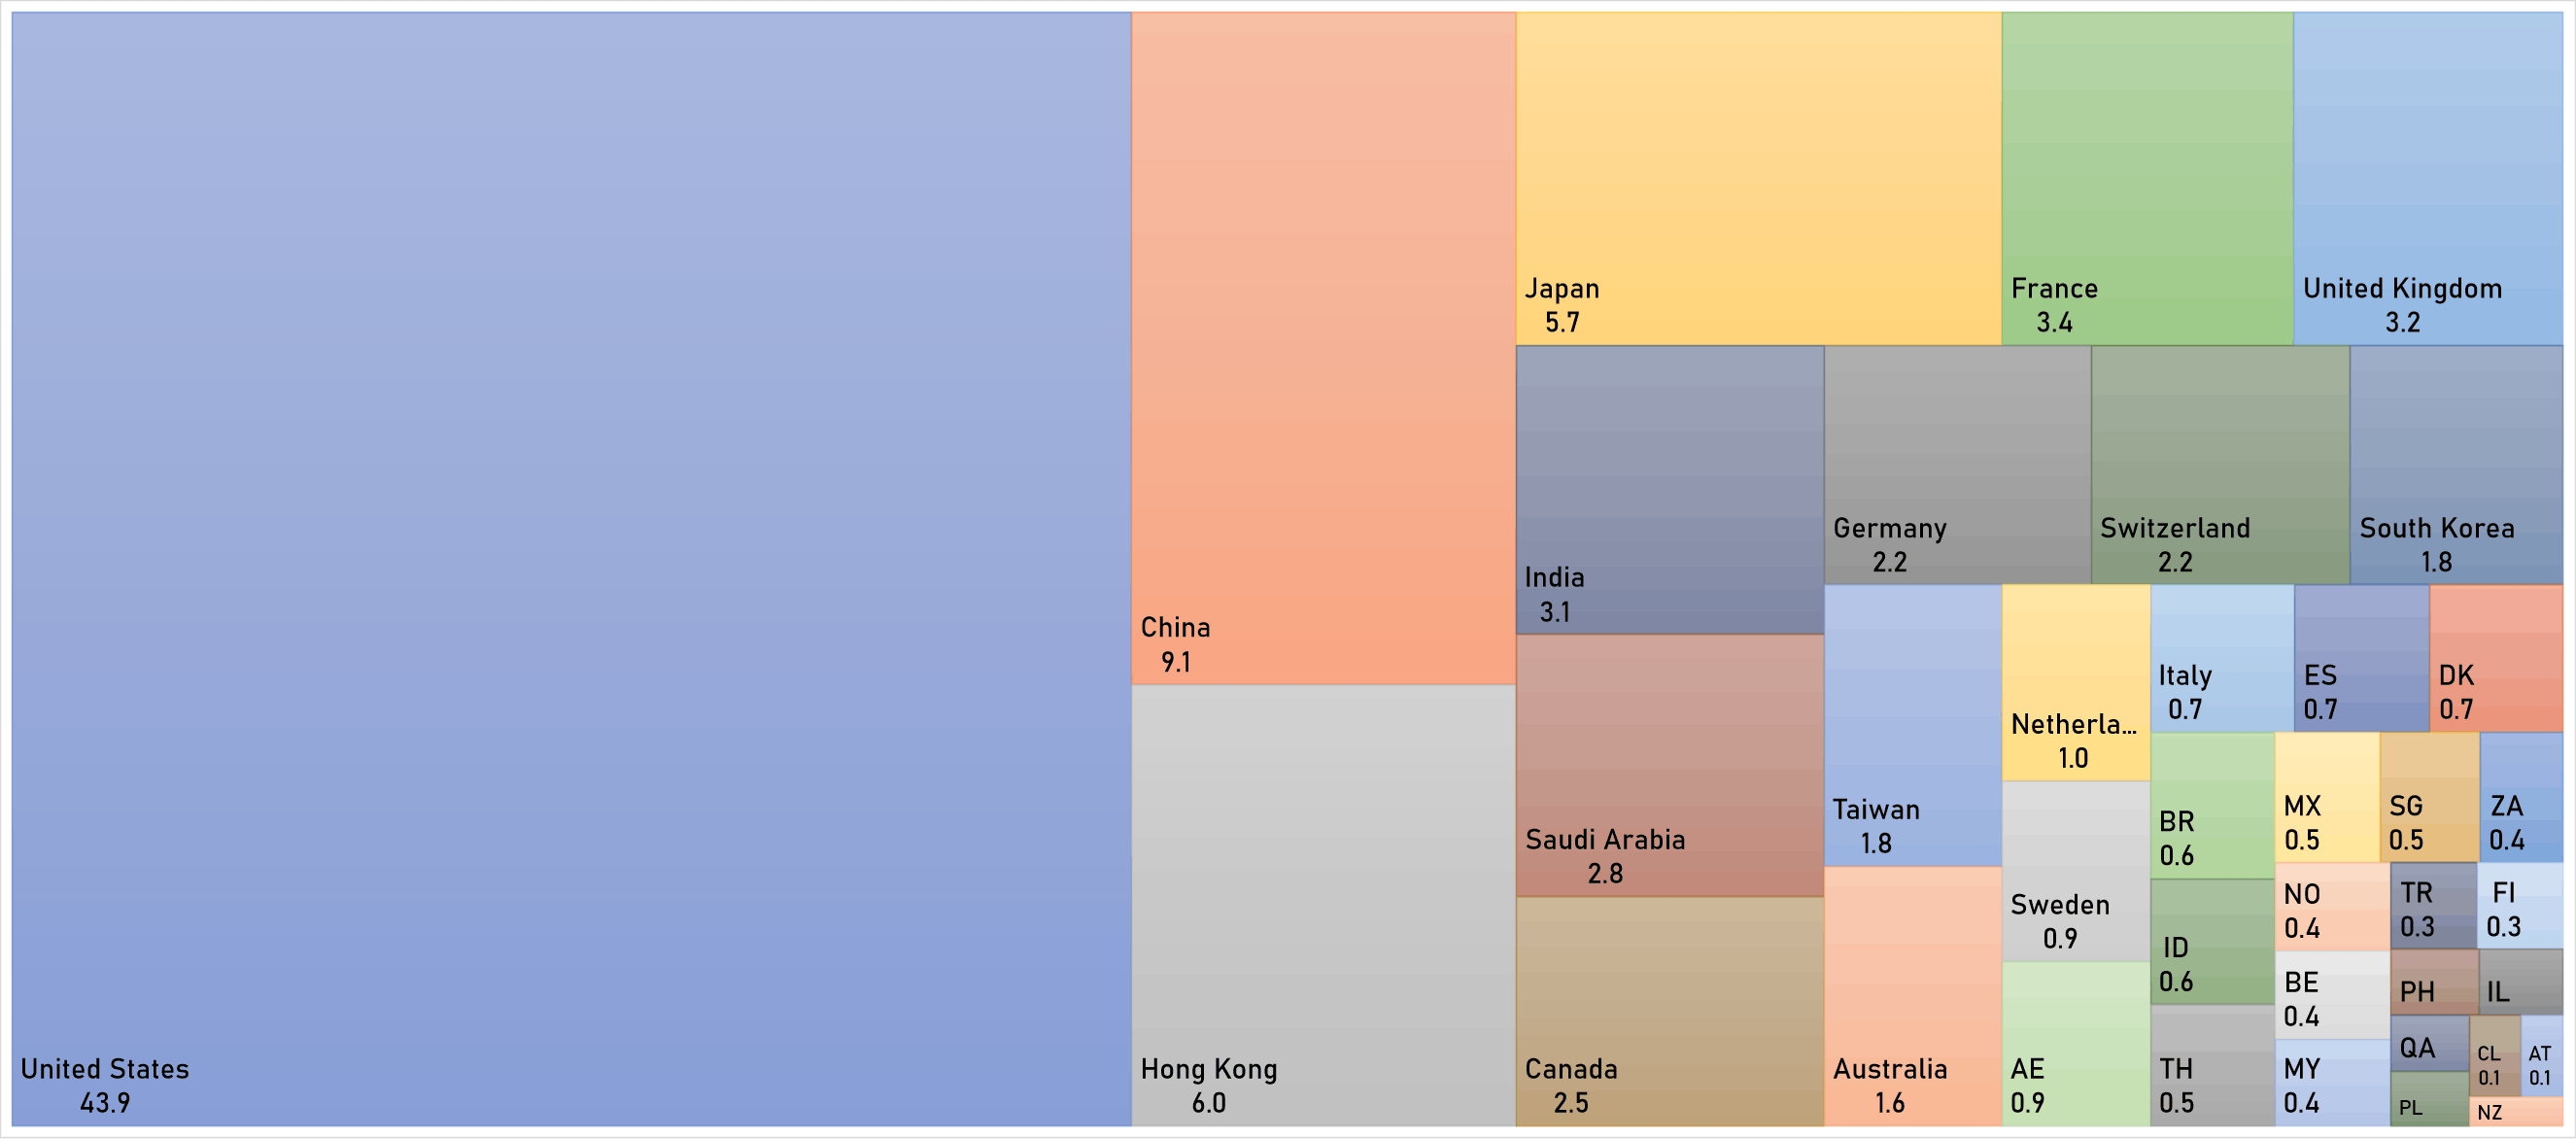
WORLD MARKET CAPITALIZATION (US$ Trillion)