Equities
US Equities Gained 50bp Over The Past Week, Capping April Total Returns Of 85bp
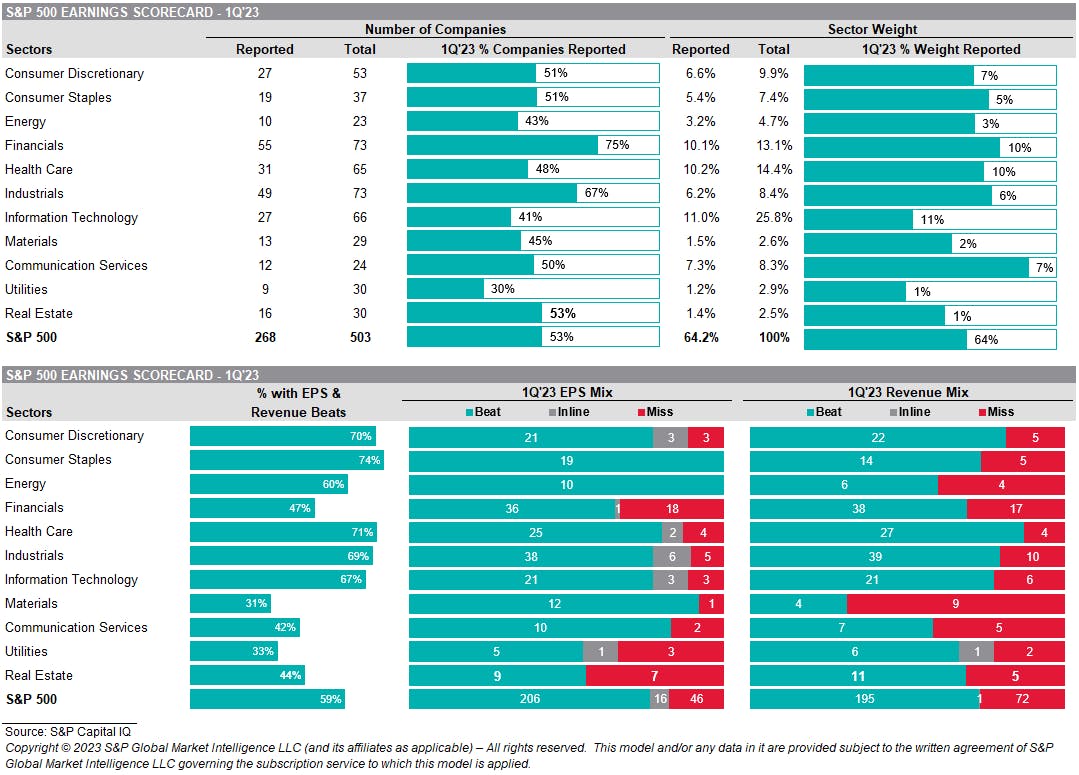
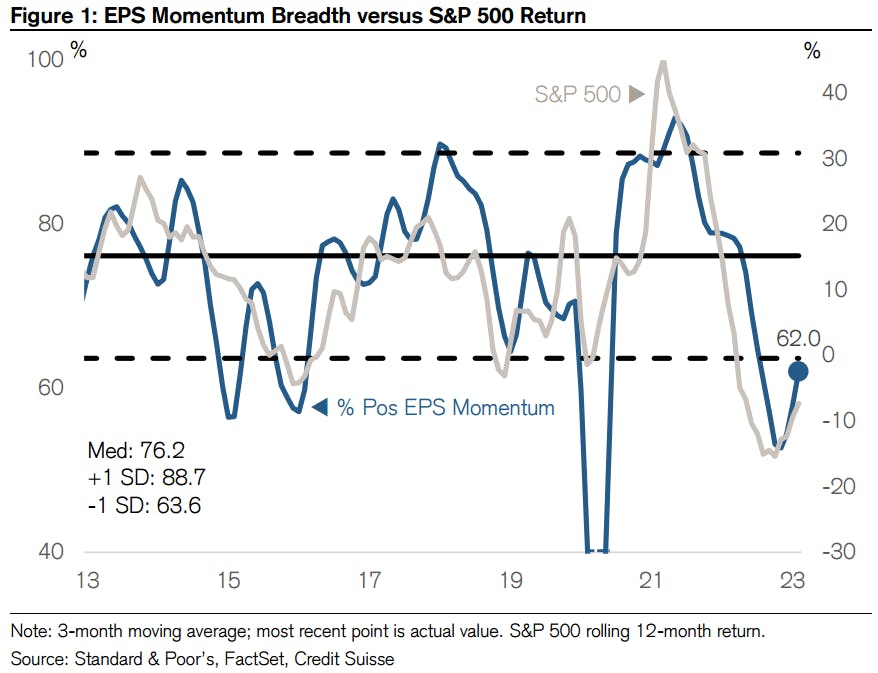
Close to two thirds of the S&P 500 by market cap has now reported 1Q 2023 earnings, and results have been better than expected (still bad), down 5% YoY against a consensus estimate of -7%
Published ET
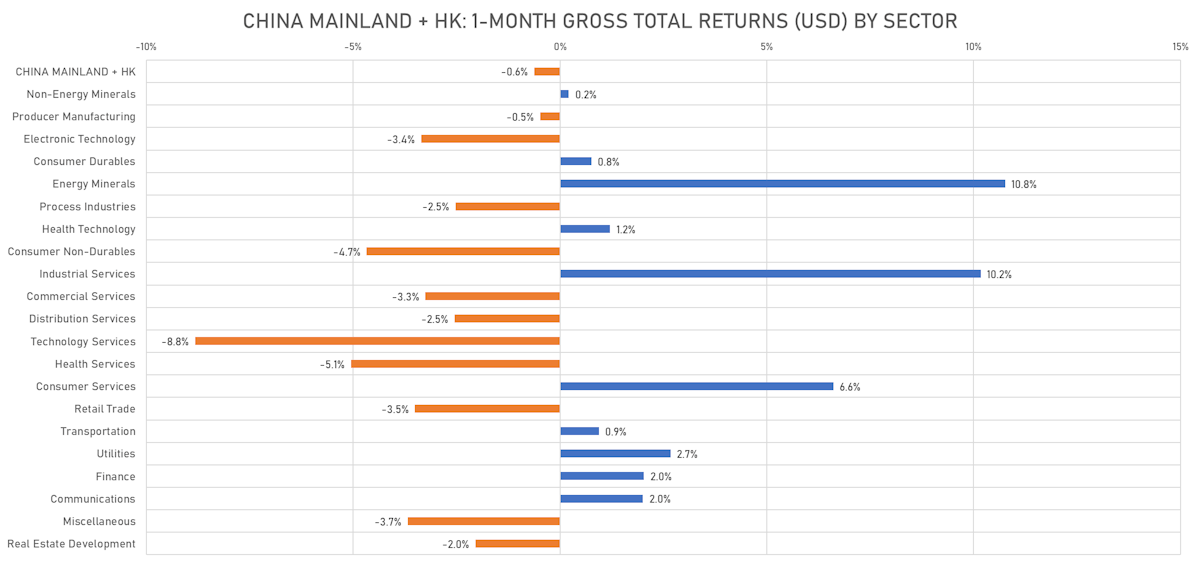
Gains In Chinese Equities Have Stalled Recently | Sources: phipost.com, FactSet data
DAILY SUMMARY
- Daily performance of US indices: S&P 500 up 0.83%; Nasdaq Composite up 0.69%; Wilshire 5000 up 0.73%
- 82.3% of S&P 500 stocks were up today, with 55.1% of stocks above their 200-day moving average (DMA) and 57.7% above their 50-DMA
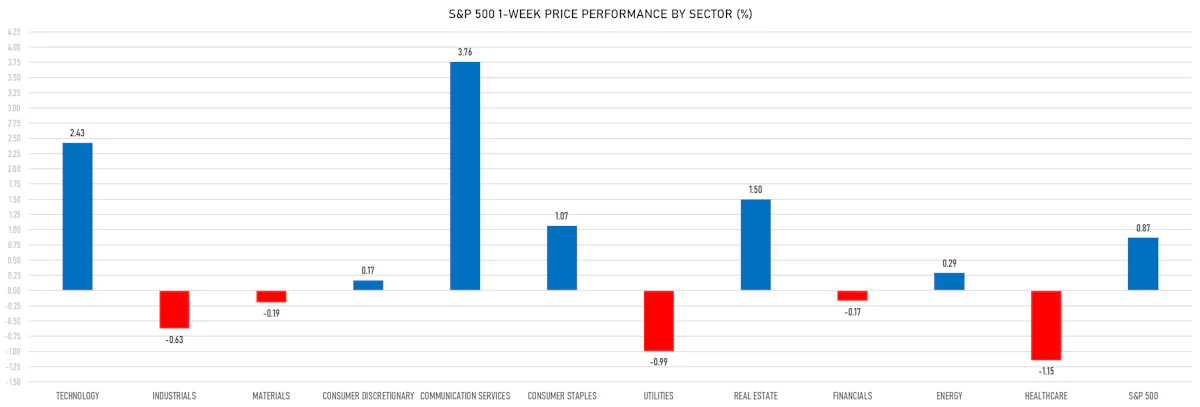
- Top performing sectors in the S&P 500: energy up 1.47% and financials up 1.19%
- Bottom performing sectors in the S&P 500: utilities down -0.19% and consumer discretionary down -0.04%
- The number of shares in the S&P 500 traded today was 788m for a total turnover of US$ 76 bn
- The S&P 500 Value Index Index was up 0.8%, while the S&P 500 Growth Index Index was up 0.8%; the S&P small caps index was up 1.3% and mid caps were up 1.2%
- The volume on CME's INX (S&P 500 Index) was 2,723.3m (3-month z-score: 0.3); the 3-month average volume is 2543.6m and the 12-month range is 903.0 - 5,761.3m
- Daily performance of international indices: Europe Stoxx 600 up 0.56%; UK FTSE 100 up 0.50%; Hang Seng SH-SZ-HK 300 Index up 0.74%; Japan's TOPIX 500 up 1.19%
VOLATILITY TODAY
- 3-month at-the-money implied volatility on the S&P 500 at 12.5%, down from 13.6%
- 3-month at-the-money implied volatility on the STOXX Europe 600 at 11.8%, down from 12.4%
TOP WINNERS TODAY
- TOP Financial Group Ltd (TOP), up 441.1% to $108.21 / YTD price return: +2,117.4% / 12-Month Price Range: $ 3.50-108.21 / Short interest (% of float): 6.3%; days to cover: 0.8
- U Power Ltd (UCAR), up 26.2% to $6.79 / 12-Month Price Range: $ 3.99-75.00
- ImmunoGen Inc (IMGN), up 24.8% to $5.39 / YTD price return: +8.7% / 12-Month Price Range: $ 3.10-6.63 / Short interest (% of float): 10.9%; days to cover: 8.9
- Beazer Homes USA Inc (BZH), up 24.0% to $21.31 / YTD price return: +67.0% / 12-Month Price Range: $ 9.47-21.31 / Short interest (% of float): 3.2%; days to cover: 3.5
- AMTD Digital Inc (HKD), up 23.9% to $8.40 / YTD price return: -16.0% / 12-Month Price Range: $ 6.51-2,555.30 / Short interest (% of float): 12.4%; days to cover: 1.5
- Yatsen Holding Ltd (YSG), up 22.4% to $1.01 / YTD price return: -30.8% / 12-Month Price Range: $ 0.39-2.20 / Short interest (% of float): 1.4%; days to cover: 3.0
- Opera Ltd (OPRA), up 22.2% to $11.96 / YTD price return: +113.4% / 12-Month Price Range: $ 3.49-12.12 / Short interest (% of float): 0.2%; days to cover: 0.7
- Coursera Inc (COUR), up 18.7% to $12.44 / YTD price return: +5.2% / 12-Month Price Range: $ 9.81-21.38 / Short interest (% of float): 2.9%; days to cover: 4.4
- bluebird bio Inc (BLUE), up 18.2% to $4.35 / YTD price return: -37.1% / 12-Month Price Range: $ 2.78-8.58 / Short interest (% of float): 22.6%; days to cover: 4.3
- Mersana Therapeutics Inc (MRSN), up 17.7% to $4.38 / YTD price return: -25.3% / 12-Month Price Range: $ 2.68-8.34 / Short interest (% of float): 6.8%; days to cover: 5.1
BIGGEST LOSERS TODAY
- First Republic Bank (FRC), down 43.3% to $3.51 / YTD price return: -97.1% / 12-Month Price Range: $ 3.51-171.09 / Short interest (% of float): 30.3%; days to cover: 0.8 (the stock is currently on the short sale restriction list)
- Addus Homecare Corp (ADUS), down 28.3% to $81.74 / YTD price return: -17.8% / 12-Month Price Range: $ 73.66-114.99 / Short interest (% of float): 3.0%; days to cover: 4.5 (the stock is currently on the short sale restriction list)
- Cloudflare Inc (NET), down 21.0% to $47.05 / YTD price return: +4.1% / 12-Month Price Range: $ 37.37-97.82 / Short interest (% of float): 7.1%; days to cover: 5.1 (the stock is currently on the short sale restriction list)
- Alteryx Inc (AYX), down 19.4% to $41.13 / YTD price return: -18.8% / 12-Month Price Range: $ 39.55-71.98 / Short interest (% of float): 6.0%; days to cover: 3.2 (the stock is currently on the short sale restriction list)
- Universal Insurance Holdings Inc (UVE), down 17.8% to $15.42 / YTD price return: +45.6% / 12-Month Price Range: $ 8.29-20.15 / Short interest (% of float): 1.7%; days to cover: 1.6 (the stock is currently on the short sale restriction list)
- Snap Inc (SNAP), down 17.0% to $8.71 / YTD price return: -2.7% / 12-Month Price Range: $ 7.33-30.37 / Short interest (% of float): 4.8%; days to cover: 2.0 (the stock is currently on the short sale restriction list)
- Perfect Corp (PERF), down 16.7% to $5.00 / YTD price return: -30.0% / 12-Month Price Range: $ 4.90-21.03 / Short interest (% of float): 0.2%; days to cover: 16.1 (the stock is currently on the short sale restriction list)
- Accolade Inc (ACCD), down 15.8% to $13.53 / YTD price return: +73.7% / 12-Month Price Range: $ 4.61-17.01 / Short interest (% of float): 5.0%; days to cover: 6.7 (the stock is currently on the short sale restriction list)
- Pinterest Inc (PINS), down 15.7% to $23.00 / YTD price return: -5.3% / 12-Month Price Range: $ 16.14-29.27 / Short interest (% of float): 4.3%; days to cover: 2.6 (the stock is currently on the short sale restriction list)
- Avidity Biosciences Inc (RNA), down 14.8% to $12.40 / YTD price return: -44.1% / 12-Month Price Range: $ 9.83-25.74 / Short interest (% of float): 16.9%; days to cover: 8.3 (the stock is currently on the short sale restriction list)
1Q23 EARNINGS DASHBOARD
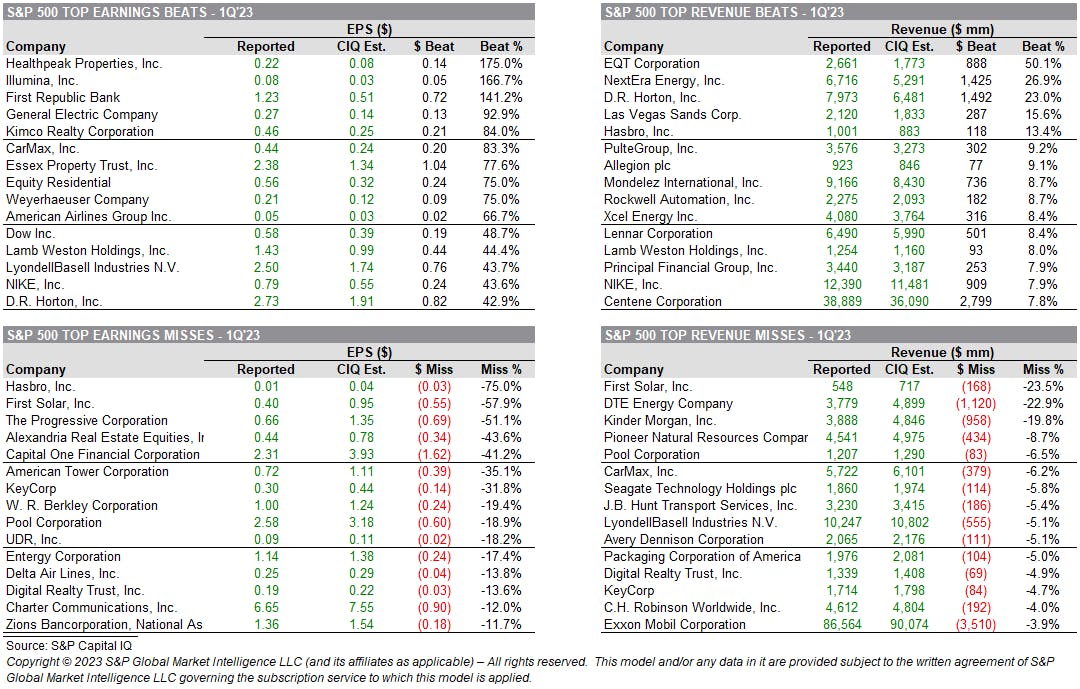
1Q23 EARNINGS: TOP BEATS & MISSES
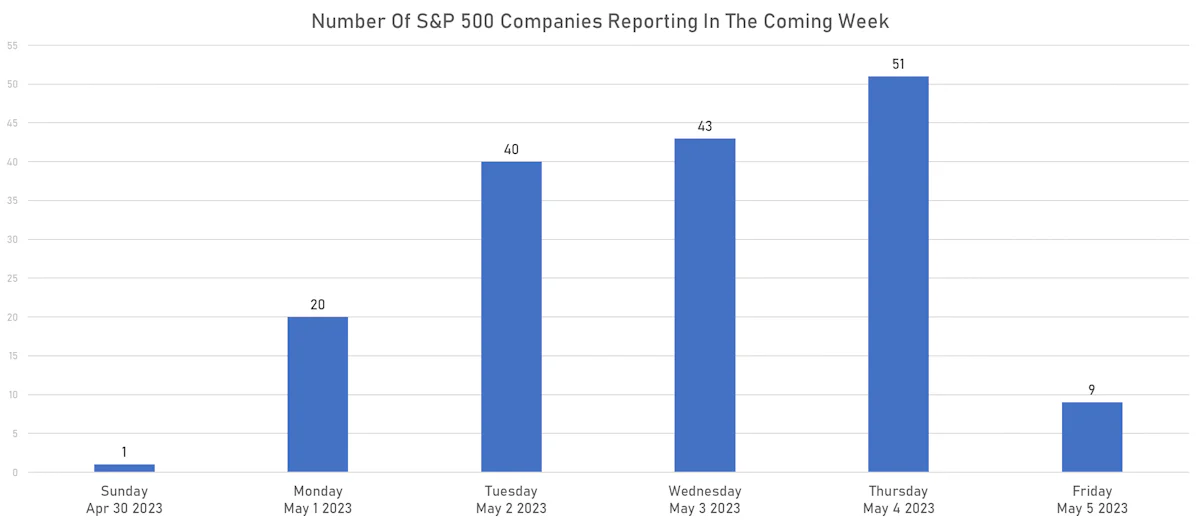
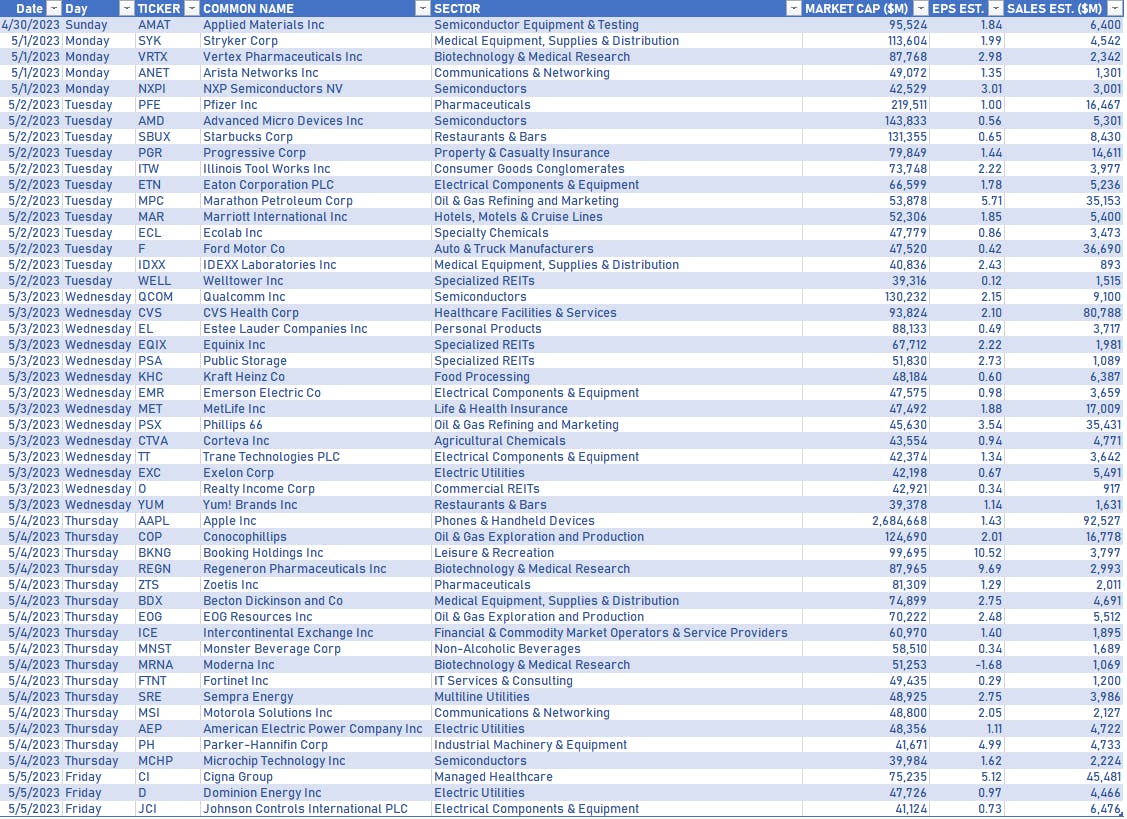
NOTABLE US EARNINGS RELEASES IN THE WEEK AHEAD
S&P 500 EARNINGS MOMENTUM AND FUTURE PERFORMANCE
TOP S&P 500 PERFORMERS THIS WEEK
- Chipotle Mexican Grill Inc (CMG), up 14.9% to $2,067.62 / YTD price return: +49.0% / 12-Month Price Range: $ 1,196.95-2,067.62 / Short interest (% of float): 2.6%; days to cover: 2.8
- Hasbro Inc (HAS), up 14.6% to $59.22 / YTD price return: -2.9% / 12-Month Price Range: $ 45.75-94.22 / Short interest (% of float): 6.3%; days to cover: 4.1
- Meta Platforms Inc (META), up 12.9% to $240.32 / YTD price return: +99.7% / 12-Month Price Range: $ 88.10-241.68 / Short interest (% of float): 1.3%; days to cover: 1.0
- Catalent Inc (CTLT), up 11.3% to $50.12 / YTD price return: +11.4% / 12-Month Price Range: $ 40.70-115.26 / Short interest (% of float): 3.3%; days to cover: 2.5
- Charter Communications Inc (CHTR), up 10.8% to $368.70 / YTD price return: +8.7% / 12-Month Price Range: $ 297.83-515.23 / Short interest (% of float): 7.3%; days to cover: 8.1
- CoStar Group Inc (CSGP), up 9.9% to $76.95 / YTD price return: -.4% / 12-Month Price Range: $ 53.51-85.34 / Short interest (% of float): 1.3%; days to cover: 2.8
- Comcast Corp (CMCSA), up 9.6% to $41.37 / YTD price return: +18.3% / 12-Month Price Range: $ 28.39-44.62 / Short interest (% of float): 1.0%; days to cover: 2.1
- Mohawk Industries Inc (MHK), up 9.2% to $105.90 / YTD price return: +3.6% / 12-Month Price Range: $ 87.12-158.03 / Short interest (% of float): 2.9%; days to cover: 2.8
- Pentair PLC (PNR), up 8.6% to $58.08 / YTD price return: +29.1% / 12-Month Price Range: $ 38.55-60.85 / Short interest (% of float): 4.2%; days to cover: 4.8
- Molina Healthcare Inc (MOH), up 8.1% to $297.89 / YTD price return: -9.8% / 12-Month Price Range: $ 250.38-374.00 / Short interest (% of float): 2.6%; days to cover: 2.8
BOTTOM S&P 500 PERFORMERS THIS WEEK
- First Republic Bank (FRC), down 75.4% to $3.51 / YTD price return: -97.1% / 12-Month Price Range: $ 3.51-171.02 / Short interest (% of float): 30.3%; days to cover: 0.8 (the stock is currently on the short sale restriction list)
- Enphase Energy Inc (ENPH), down 26.6% to $164.20 / YTD price return: -38.0% / 12-Month Price Range: $ 128.68-339.88 / Short interest (% of float): 4.5%; days to cover: 1.7
- First Solar Inc (FSLR), down 15.8% to $182.58 / YTD price return: +21.9% / 12-Month Price Range: $ 59.60-221.87 / Short interest (% of float): 4.1%; days to cover: 1.8 (the stock is currently on the short sale restriction list)
- MSCI Inc (MSCI), down 11.4% to $482.45 / YTD price return: +3.7% / 12-Month Price Range: $ 376.60-572.49 / Short interest (% of float): 0.9%; days to cover: 1.5
- Solaredge Technologies Inc (SEDG), down 10.5% to $285.63 / YTD price return: +.8% / 12-Month Price Range: $ 190.15-375.14 / Short interest (% of float): 5.1%; days to cover: 2.7
- Illumina Inc (ILMN), down 9.7% to $205.56 / YTD price return: +1.7% / 12-Month Price Range: $ 173.48-308.96 / Short interest (% of float): 2.9%; days to cover: 3.6
- Activision Blizzard Inc (ATVI), down 9.1% to $77.71 / YTD price return: +1.5% / 12-Month Price Range: $ 70.95-87.01 / Short interest (% of float): 2.6%; days to cover: 3.1
- Align Technology Inc (ALGN), down 8.4% to $325.30 / YTD price return: +54.2% / 12-Month Price Range: $ 172.29-368.63 / Short interest (% of float): 3.4%; days to cover: 2.8
- Northern Trust Corp (NTRS), down 8.4% to $78.16 / YTD price return: -11.7% / 12-Month Price Range: $ 75.98-113.12 / Short interest (% of float): 1.4%; days to cover: 2.2
- Old Dominion Freight Line Inc (ODFL), down 8.2% to $320.39 / YTD price return: +12.9% / 12-Month Price Range: $ 231.53-381.74 / Short interest (% of float): 5.0%; days to cover: 7.1
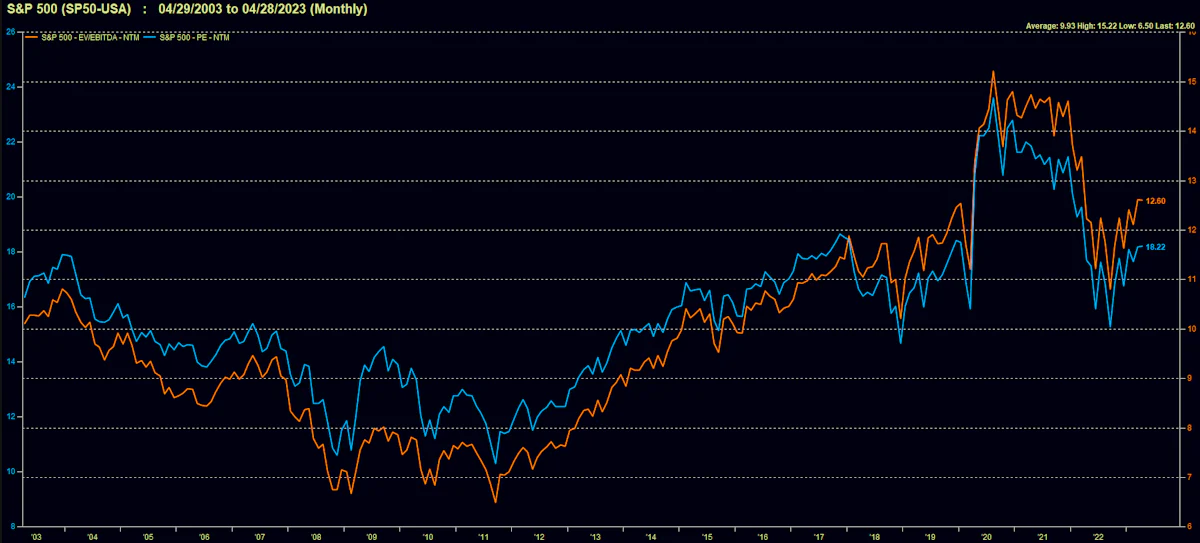
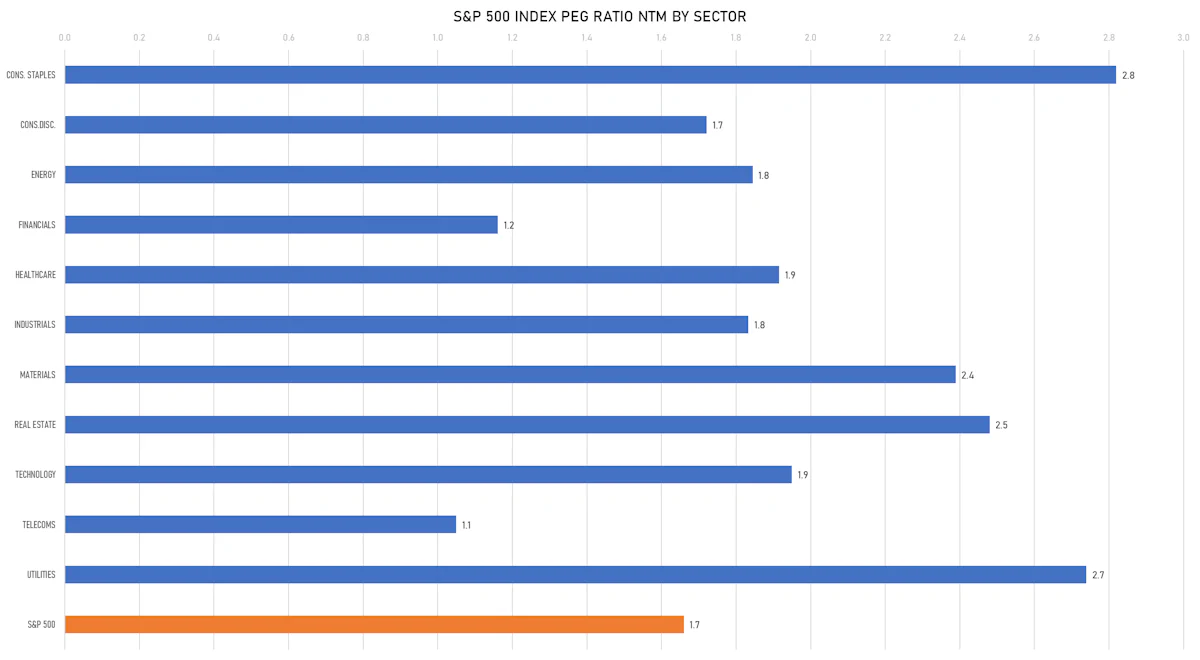
VALUATION MULTIPLES BY SECTORS
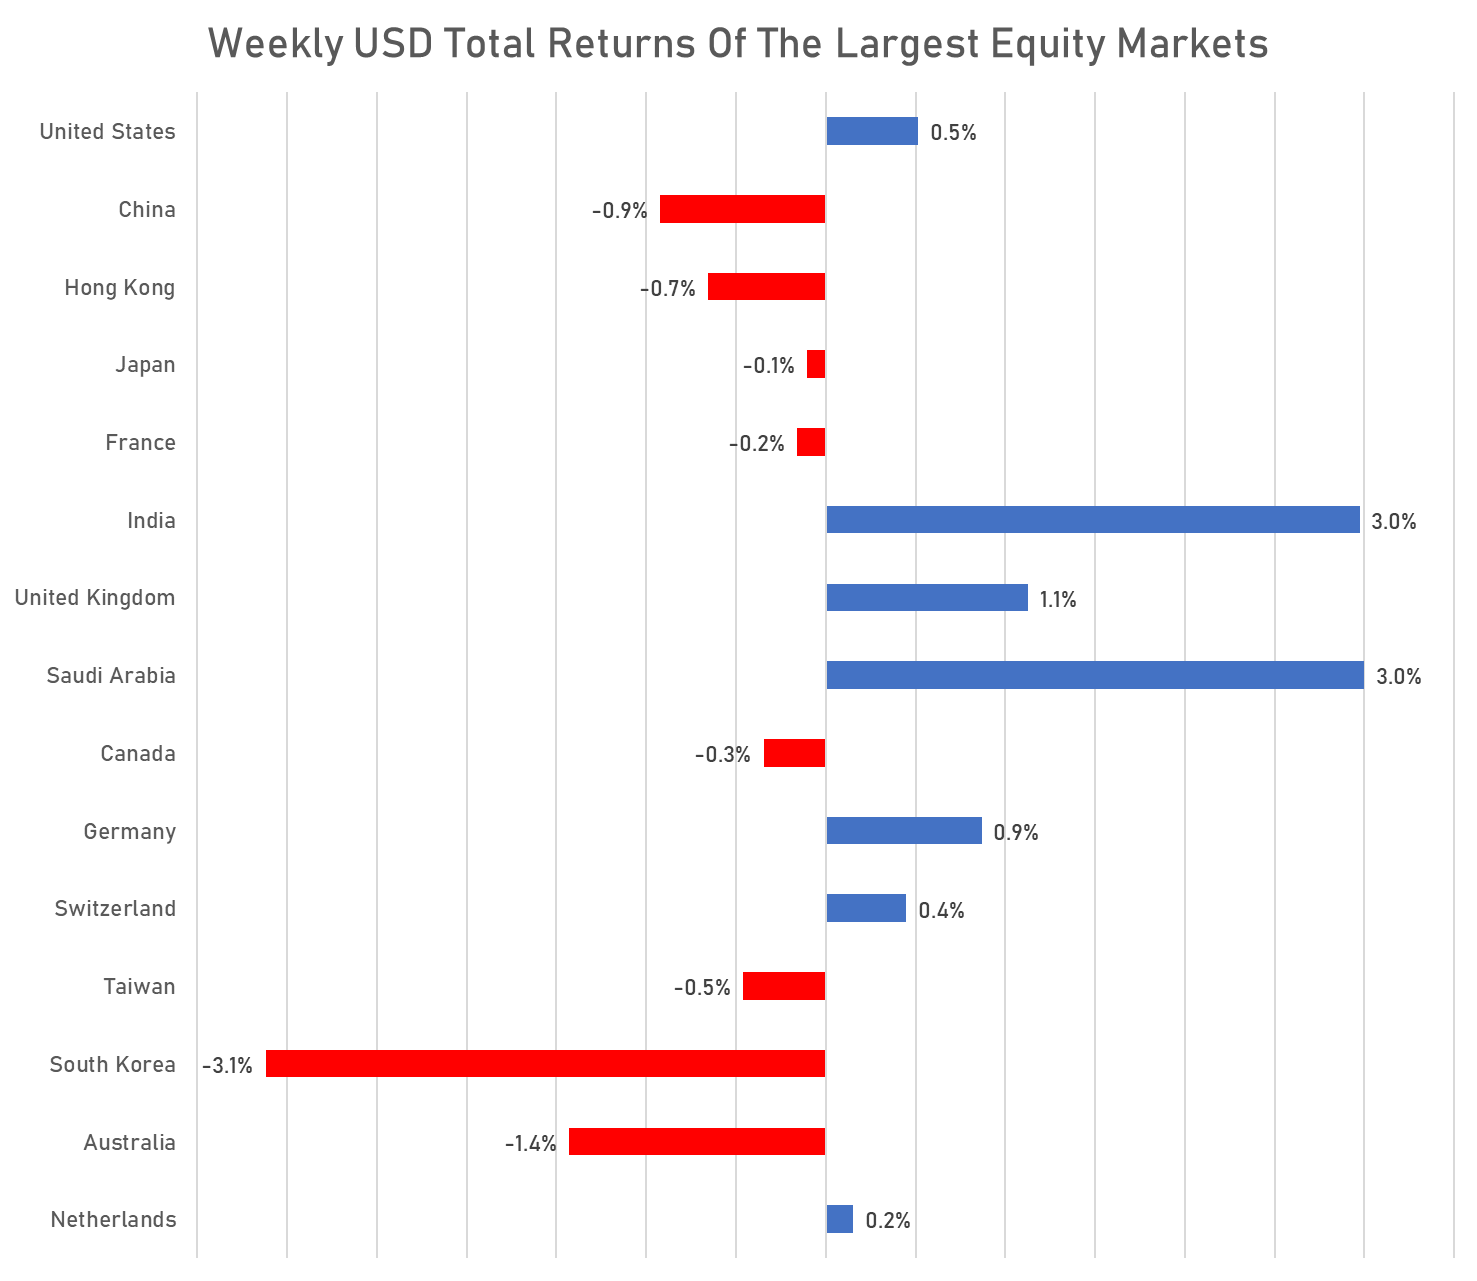
WEEKLY TOTAL RETURNS OF MAJOR GLOBAL EQUITY MARKETS
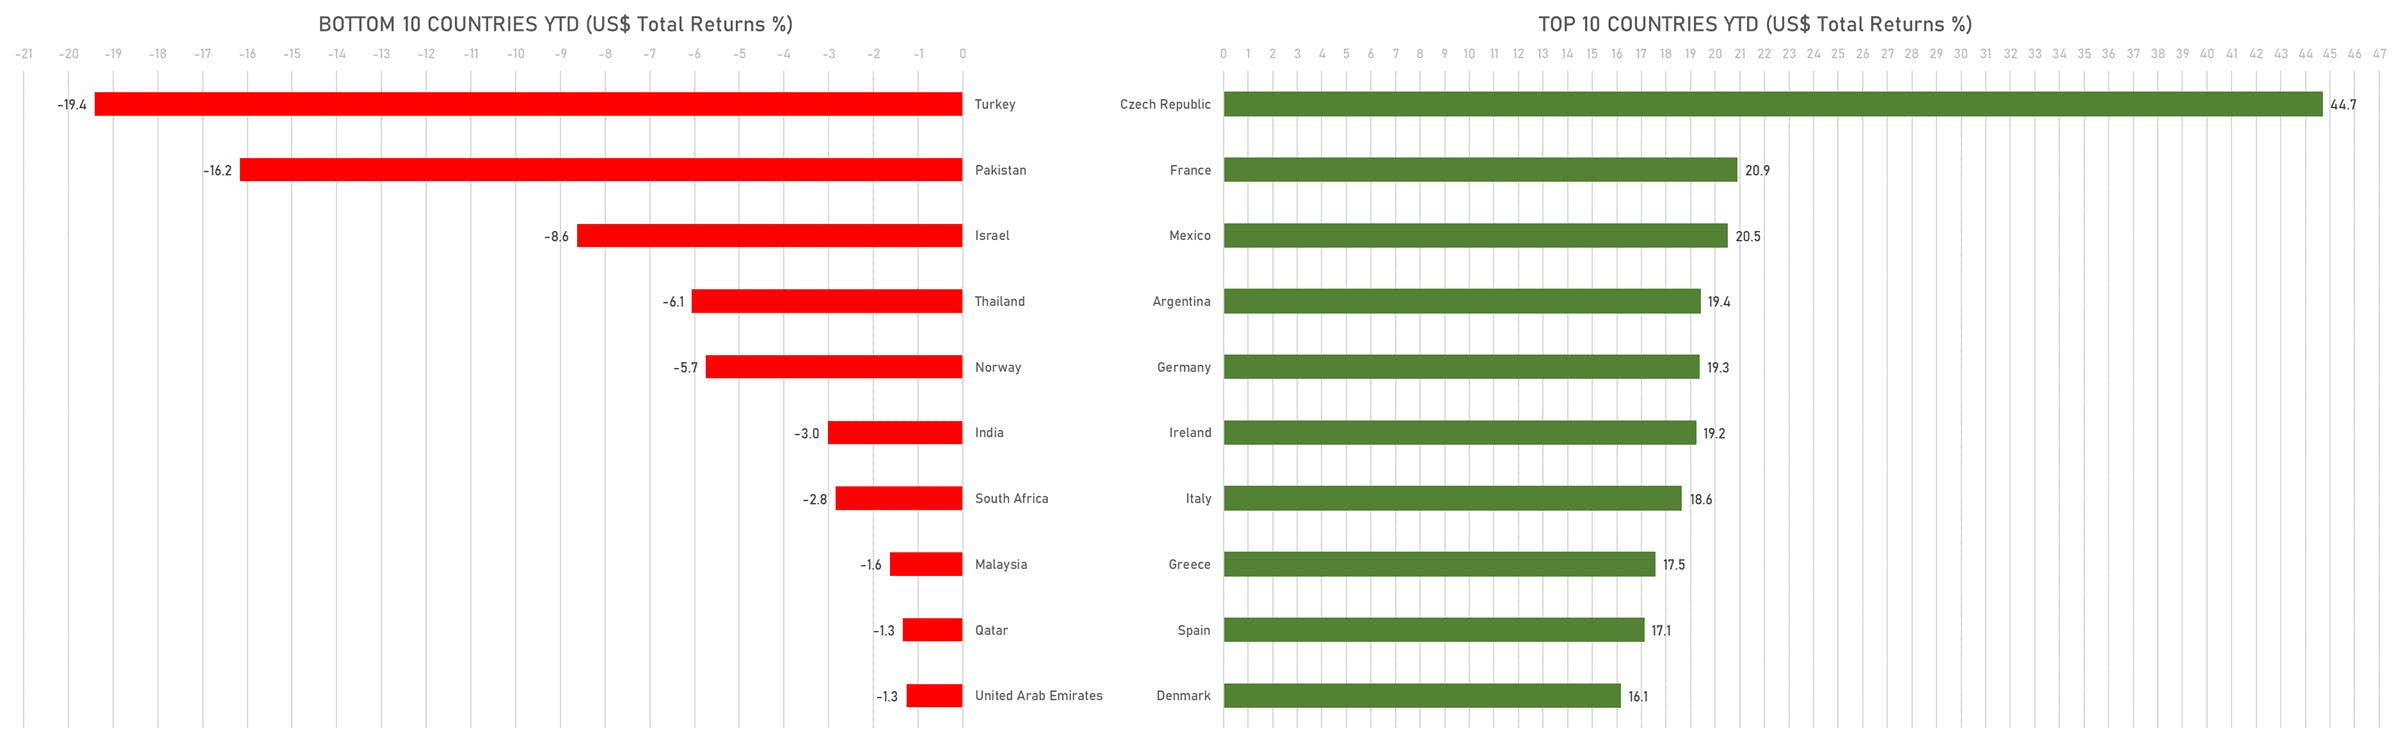
TOP / BOTTOM PERFORMING WORLD MARKETS YTD
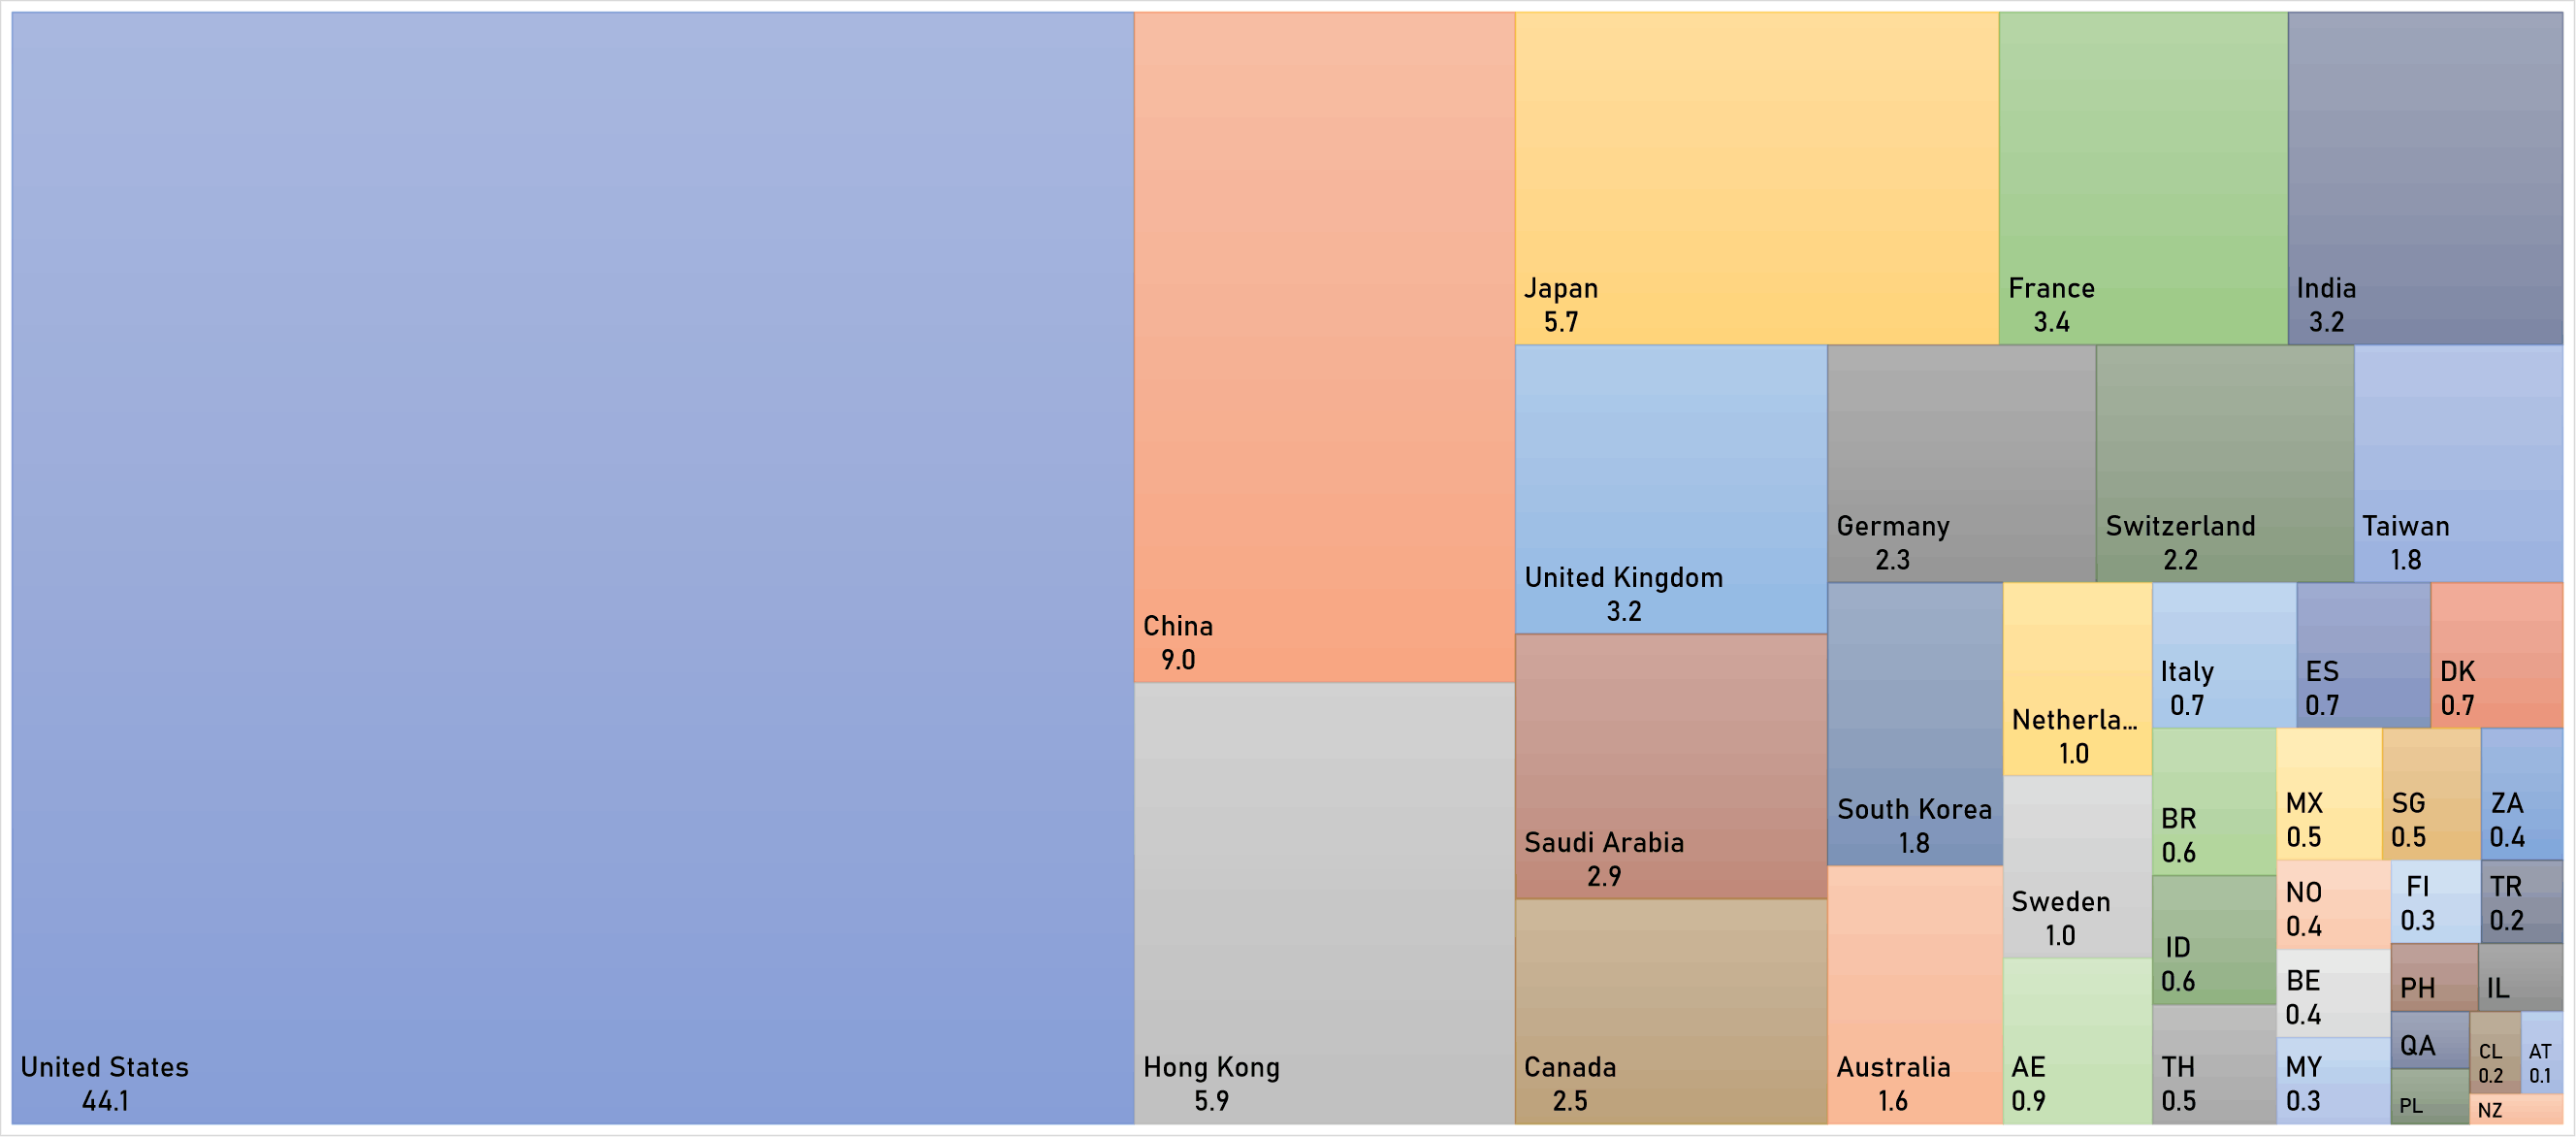
WORLD MARKET CAPITALIZATION (US$ Trillion)