Equities
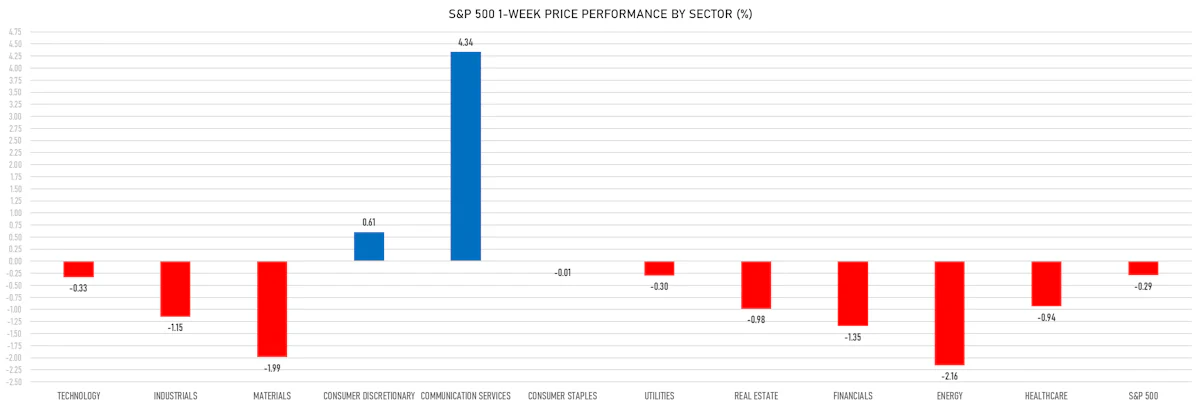
Tech Outperformed The S&P 500 By 5% This Week As Mega Caps Continue To Lead US Equities
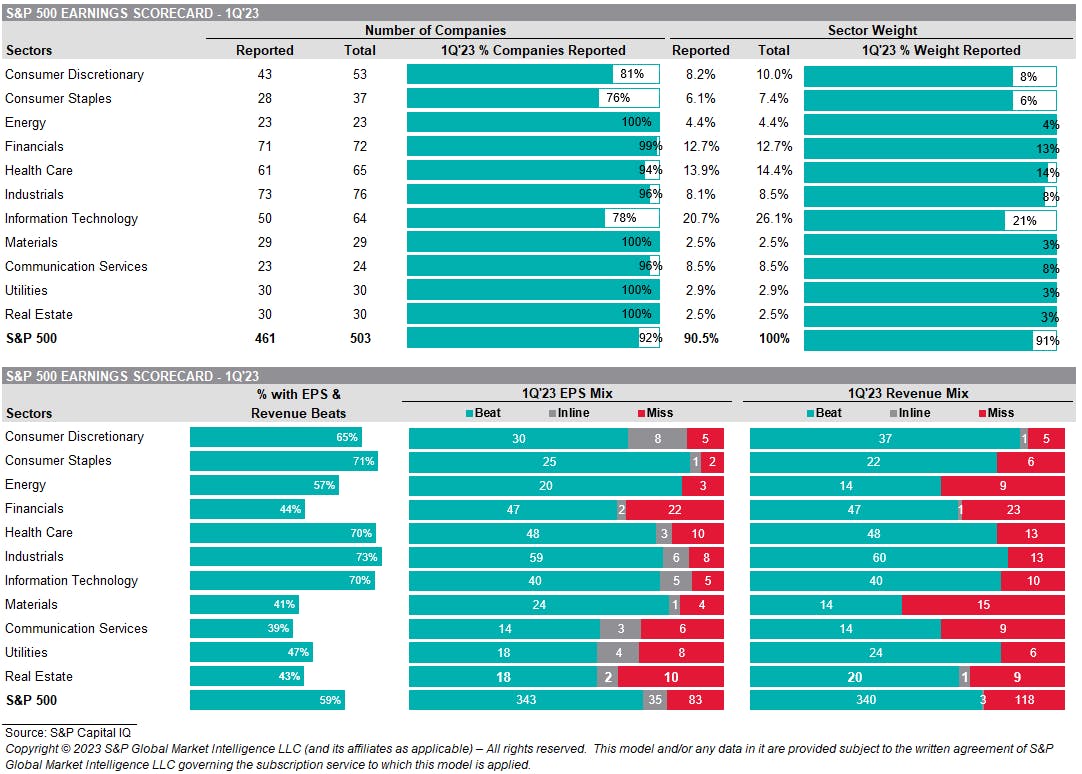
Net margins for the first quarter have contracted much less than expected (99bp vs 146bp) but investors remain very prudent, pointing to a possible upward path as long as growth remains fairly robust
Published ET
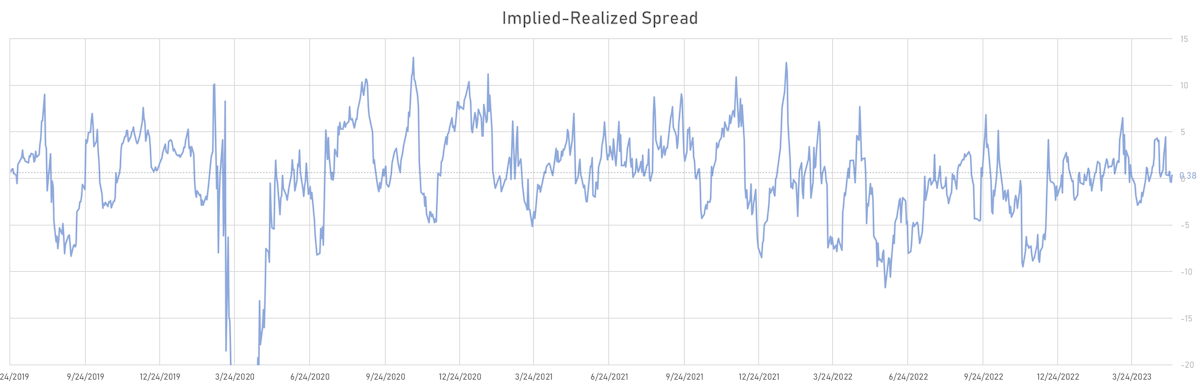
S&P 500 1-Month Implied - Realized Volatility Spread | Sources: phipost.com, Refinitiv data
DAILY SUMMARY
- Daily performance of US indices: S&P 500 down -0.16%; Nasdaq Composite down -0.35%; Wilshire 5000 down -0.20%
- 49.3% of S&P 500 stocks were up today, with 45.7% of stocks above their 200-day moving average (DMA) and 46.1% above their 50-DMA
- Top performing sectors in the S&P 500: utilities up 0.44% and consumer staples up 0.36%
- Bottom performing sectors in the S&P 500: consumer discretionary down -0.89% and financials down -0.41%
- The number of shares in the S&P 500 traded today was 552m for a total turnover of US$ 53 bn
- The S&P 500 Value Index Index was down -0.2%, while the S&P 500 Growth Index Index was down -0.1%; the S&P small caps index was down -0.3% and mid caps were down -0.1%
- The volume on CME's INX (S&P 500 Index) was 2076.6m (3-month z-score: -0.7); the 3-month average volume is 2493.3m and the 12-month range is 903.0 - 5761.3m
- Daily performance of international indices: Europe Stoxx 600 up 0.40%; UK FTSE 100 up 0.31%; Hang Seng SH-SZ-HK 300 Index down -0.74%; Japan's TOPIX 500 up 0.68%
VOLATILITY TODAY
- 3-month at-the-money implied volatility on the S&P 500 at 13.6%, down from 13.6%
- 3-month at-the-money implied volatility on the STOXX Europe 600 at 11.3%, down from 12.8%
TOP WINNERS TODAY
- ARS Pharmaceuticals Inc (SPRY), up 77.9% to $8.04 / YTD price return: -5.7% / 12-Month Price Range: $ 2.80-9.23 / Short interest (% of float): 5.1%; days to cover: 11.1
- Airsculpt Technologies Inc (AIRS), up 37.4% to $6.72 / YTD price return: +81.6% / 12-Month Price Range: $ 2.69-11.26 / Short interest (% of float): 24.0%; days to cover: 18.1
- Blue Bird Corp (BLBD), up 36.3% to $26.33 / YTD price return: +145.8% / 12-Month Price Range: $ 7.14-26.33 / Short interest (% of float): 2.6%; days to cover: 4.5
- AlTi Global, Inc (ALTI), up 28.0% to $6.27 / YTD price return: -42.5% / 12-Month Price Range: $ 3.88-28.49 / Short interest (% of float): 1.5%; days to cover: 3.0
- Arlo Technologies Inc (ARLO), up 27.2% to $8.97 / YTD price return: +155.6% / 12-Month Price Range: $ 2.93-8.97 / Short interest (% of float): 2.9%; days to cover: 3.1
- Ohmyhome Ltd (OMH), up 27.2% to $18.46 / 12-Month Price Range: $ 3.80-27.13 / Short interest (% of float): 0.2%; days to cover: 0.1 (the stock is currently on the short sale restriction list)
- Venus Concept Inc (VERO), up 26.8% to $4.28 / YTD price return: -10.8% / 12-Month Price Range: $ 2.25-13.80 / Short interest (% of float): 0.0%; days to cover: 0.1
- First Solar Inc (FSLR), up 26.5% to $231.69 / YTD price return: +54.7% / 12-Month Price Range: $ 59.60-231.69 / Short interest (% of float): 3.6%
- Innodata Inc (INOD), up 17.7% to $9.29 / YTD price return: +213.3% / 12-Month Price Range: $ 2.78-9.29 / Short interest (% of float): 1.9%; days to cover: 3.3
- SHENGFENG DEVELOPMENT Ltd (SFWL), up 17.1% to $7.95 / 12-Month Price Range: $ 2.94-12.45 / Short interest (% of float): 1.6%; days to cover: 0.3
BIGGEST LOSERS TODAY
- TOP Financial Group Ltd (TOP), down 29.7% to $9.13 / YTD price return: +87.1% / 12-Month Price Range: $ 3.50-256.44 / Short interest (% of float): 4.8%; days to cover: 0.1 (the stock is currently on the short sale restriction list)
- AVITA Medical Inc (RCEL), down 22.9% to $12.11 / YTD price return: +83.5% / 12-Month Price Range: $ 4.41-16.89 / Short interest (% of float): 10.4%; days to cover: 3.2 (the stock is currently on the short sale restriction list)
- Youdao Inc (DAO), down 20.9% to $5.01 / YTD price return: -6.9% / 12-Month Price Range: $ 3.03-10.00 / Short interest (% of float): 1.1%; days to cover: 1.2 (the stock is currently on the short sale restriction list)
- OraSure Technologies Inc (OSUR), down 18.7% to $6.01 / YTD price return: +24.7% / 12-Month Price Range: $ 2.62-7.82 / Short interest (% of float): 1.8%; days to cover: 2.4 (the stock is currently on the short sale restriction list)
- Harrow Health Inc (HROW), down 18.6% to $22.04 / YTD price return: +49.3% / 12-Month Price Range: $ 5.40-28.25 / Short interest (% of float): 7.8%; days to cover: 5.9 (the stock is currently on the short sale restriction list)
- Immunitybio Inc (IBRX), down 18.3% to $2.28 / YTD price return: -55.0% / 12-Month Price Range: $ 1.21-7.80 / Short interest (% of float): 27.6%; days to cover: 5.9 (the stock is currently on the short sale restriction list)
- Dingdong (Cayman) Ltd (DDL), down 17.8% to $3.32 / YTD price return: -22.2% / 12-Month Price Range: $ 2.43-6.90 / Short interest (% of float): 2.4%; days to cover: 5.7 (the stock is currently on the short sale restriction list)
- Applied Digital Corp (APLD), down 17.5% to $2.88 / YTD price return: +56.5% / 12-Month Price Range: $ .85-5.00 / Short interest (% of float): 4.8%; days to cover: 3.3 (the stock is currently on the short sale restriction list)
- Archer Aviation Inc (ACHR), down 15.6% to $2.00 / YTD price return: +7.0% / 12-Month Price Range: $ 1.62-5.17 / Short interest (% of float): 8.8%; days to cover: 7.2 (the stock is currently on the short sale restriction list)
- Emergent BioSolutions Inc (EBS), down 12.7% to $9.18 / YTD price return: -22.3% / 12-Month Price Range: $ 7.74-40.45 / Short interest (% of float): 13.3%; days to cover: 2.8 (the stock is currently on the short sale restriction list)
1Q23 EARNINGS DASHBOARD
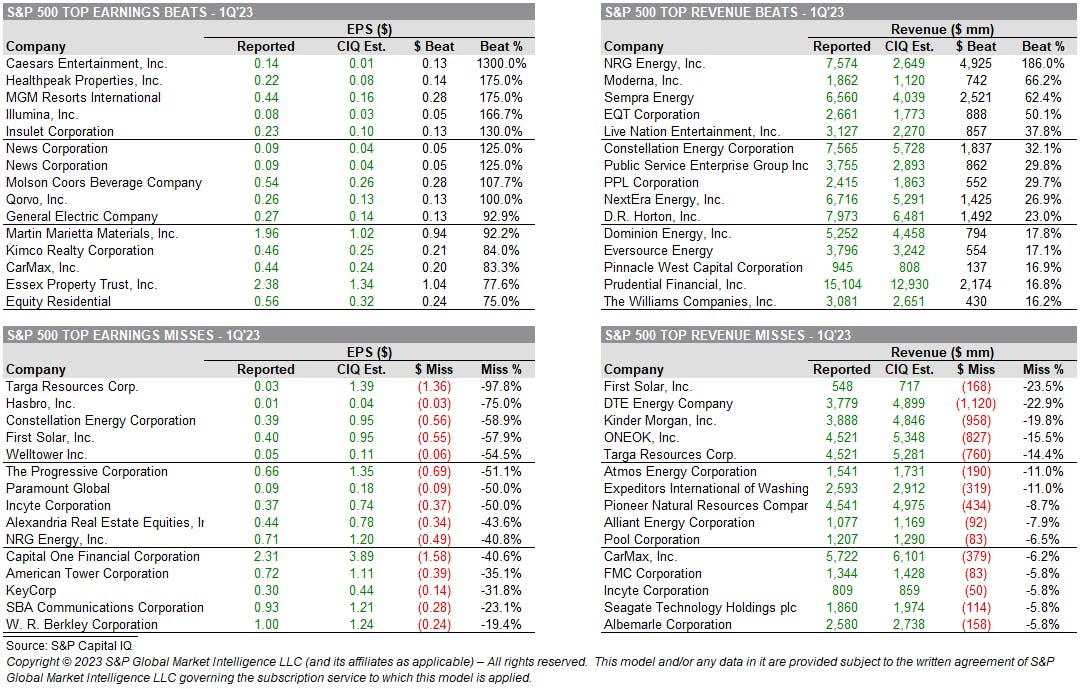
1Q23 EARNINGS: TOPS BEATS & MISSES
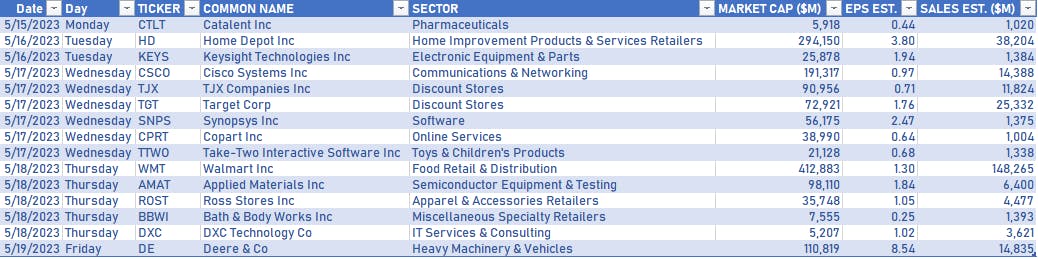
NOTABLE EARNINGS IN THE WEEK AHEAD
TOP S&P 500 PERFORMERS THIS WEEK
- First Solar Inc (FSLR), up 29.7% to $231.69 / YTD price return: +54.7% / 12-Month Price Range: $ 59.60-231.69 / Short interest (% of float): 3.6%; days to cover: 1.6
- STERIS plc (STE), up 11.5% to $210.85 / YTD price return: +14.2% / 12-Month Price Range: $ 159.47-236.10 / Short interest (% of float): 2.2%; days to cover: 5.5
- Alphabet Inc (GOOGL), up 11.3% to $117.51 / YTD price return: +33.2% / 12-Month Price Range: $ 83.34-122.42 / Short interest (% of float): 0.8%; days to cover: 1.4
- Alphabet Inc (GOOG), up 11.0% to $117.92 / YTD price return: +32.9% / 12-Month Price Range: $ 83.46-123.25 / Short interest (% of float): 0.7%; days to cover: 1.3
- Albemarle Corp (ALB), up 9.0% to $195.79 / YTD price return: -9.7% / 12-Month Price Range: $ 171.93-334.25 / Short interest (% of float): 4.7%; days to cover: 2.3
- Akamai Technologies Inc (AKAM), up 8.6% to $85.32 / YTD price return: +1.2% / 12-Month Price Range: $ 70.65-102.77 / Short interest (% of float): 6.4%; days to cover: 6.6
- Mckesson Corp (MCK), up 6.6% to $389.97 / YTD price return: +4.0% / 12-Month Price Range: $ 298.79-401.57 / Short interest (% of float): 1.5%; days to cover: 2.2
- News Corp (NWSA), up 6.1% to $18.16 / YTD price return: -.2% / 12-Month Price Range: $ 14.88-21.69 / Short interest (% of float): 3.0%; days to cover: 4.5
- Advanced Micro Devices Inc (AMD), up 6.0% to $95.26 / YTD price return: +47.1% / 12-Month Price Range: $ 54.58-109.57 / Short interest (% of float): 1.7%; days to cover: 0.5
- News Corp (NWS), up 6.0% to $18.29 / YTD price return: -.8% / 12-Month Price Range: $ 15.16-21.86 / Short interest (% of float): 1.7%; days to cover: 2.5
BOTTOM S&P 500 PERFORMERS THIS WEEK
- Catalent Inc (CTLT), down 31.2% to $32.86 / YTD price return: -27.0% / 12-Month Price Range: $ 32.43-115.26 / Short interest (% of float): 3.5%; days to cover: 1.6
- Tyson Foods Inc (TSN), down 19.5% to $48.87 / YTD price return: -21.5% / 12-Month Price Range: $ 47.11-92.34 / Short interest (% of float): 1.7%; days to cover: 1.8
- PayPal Holdings Inc (PYPL), down 17.7% to $61.69 / YTD price return: -13.4% / 12-Month Price Range: $ 61.69-103.02 / Short interest (% of float): 1.4%; days to cover: 1.4
- International Flavors & Fragrances Inc (IFF), down 13.8% to $83.16 / YTD price return: -20.7% / 12-Month Price Range: $ 81.60-135.14 / Short interest (% of float): 1.6%; days to cover: 2.4
- DISH Network Corp (DISH), down 13.5% to $6.16 / YTD price return: -56.1% / 12-Month Price Range: $ 6.10-23.45 / Short interest (% of float): 20.1%; days to cover: 6.0
- Comerica Inc (CMA), down 12.3% to $31.97 / YTD price return: -52.2% / 12-Month Price Range: $ 28.40-87.01 / Short interest (% of float): 6.6%; days to cover: 1.9
- Paramount Global (PARA), down 10.9% to $15.02 / YTD price return: -11.0% / 12-Month Price Range: $ 15.02-34.50 / Short interest (% of float): 15.9%; days to cover: 9.4
- PerkinElmer Inc (PKI), down 10.4% to $116.30 / YTD price return: -17.1% / 12-Month Price Range: $ 113.61-170.00 / Short interest (% of float): 2.8%; days to cover: 4.8
- Mosaic Co (MOS), down 9.6% to $35.35 / YTD price return: -19.0% / 12-Month Price Range: $ 34.70-66.25 / Short interest (% of float): 2.6%; days to cover: 2.1
- Waters Corp (WAT), down 8.7% to $271.00 / YTD price return: -20.9% / 12-Month Price Range: $ 263.04-369.00 / Short interest (% of float): 3.8%; days to cover: 6.0
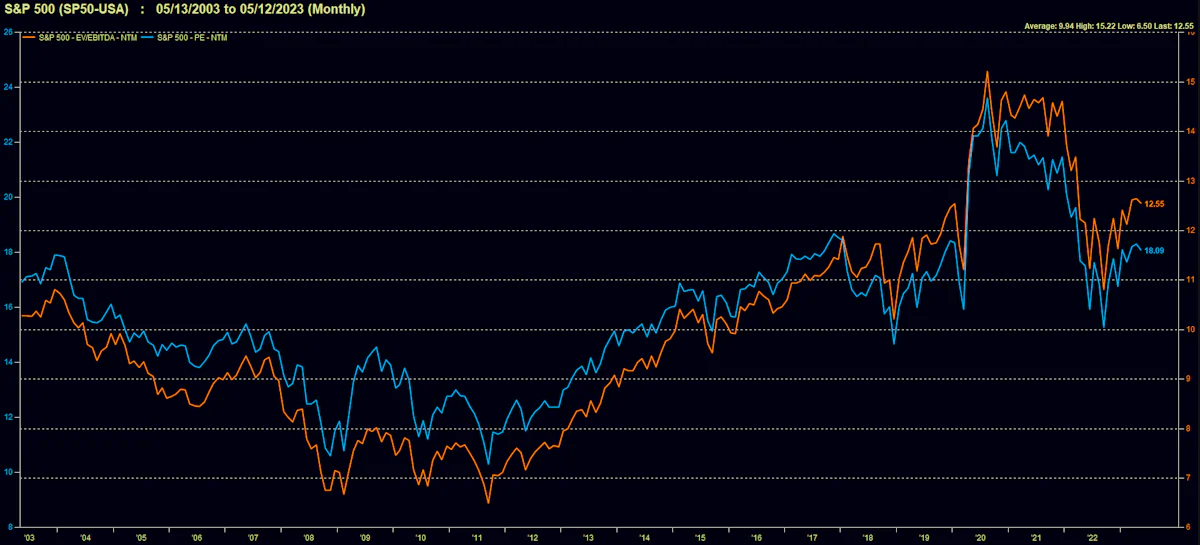
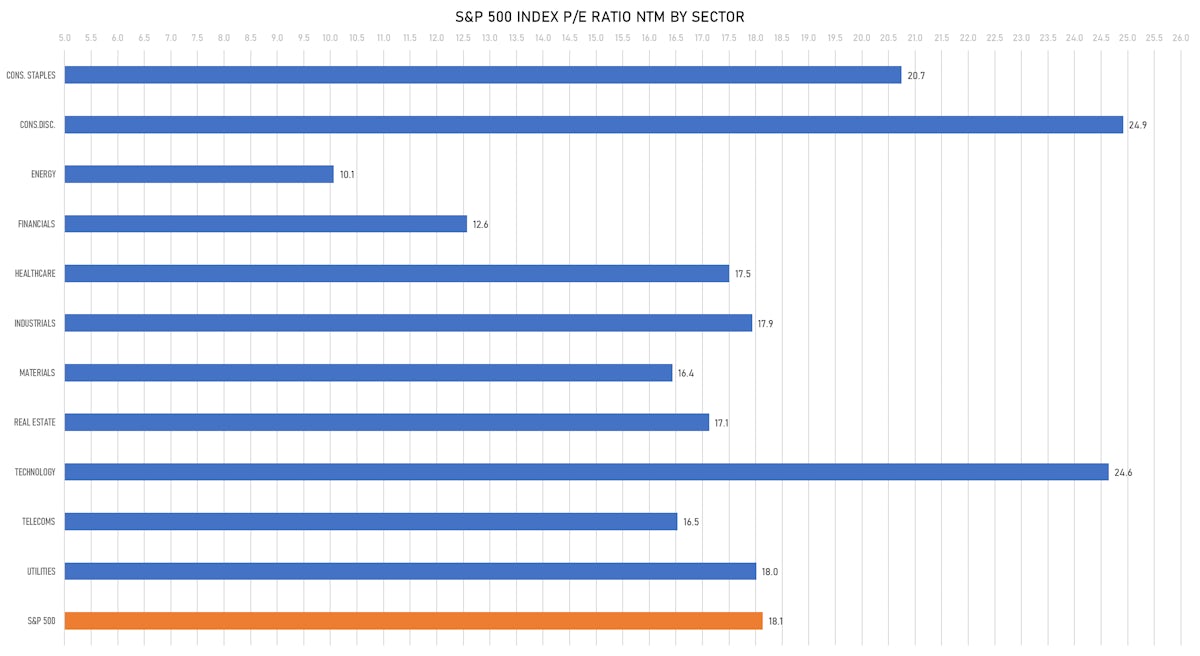
VALUATION MULTIPLES BY SECTORS
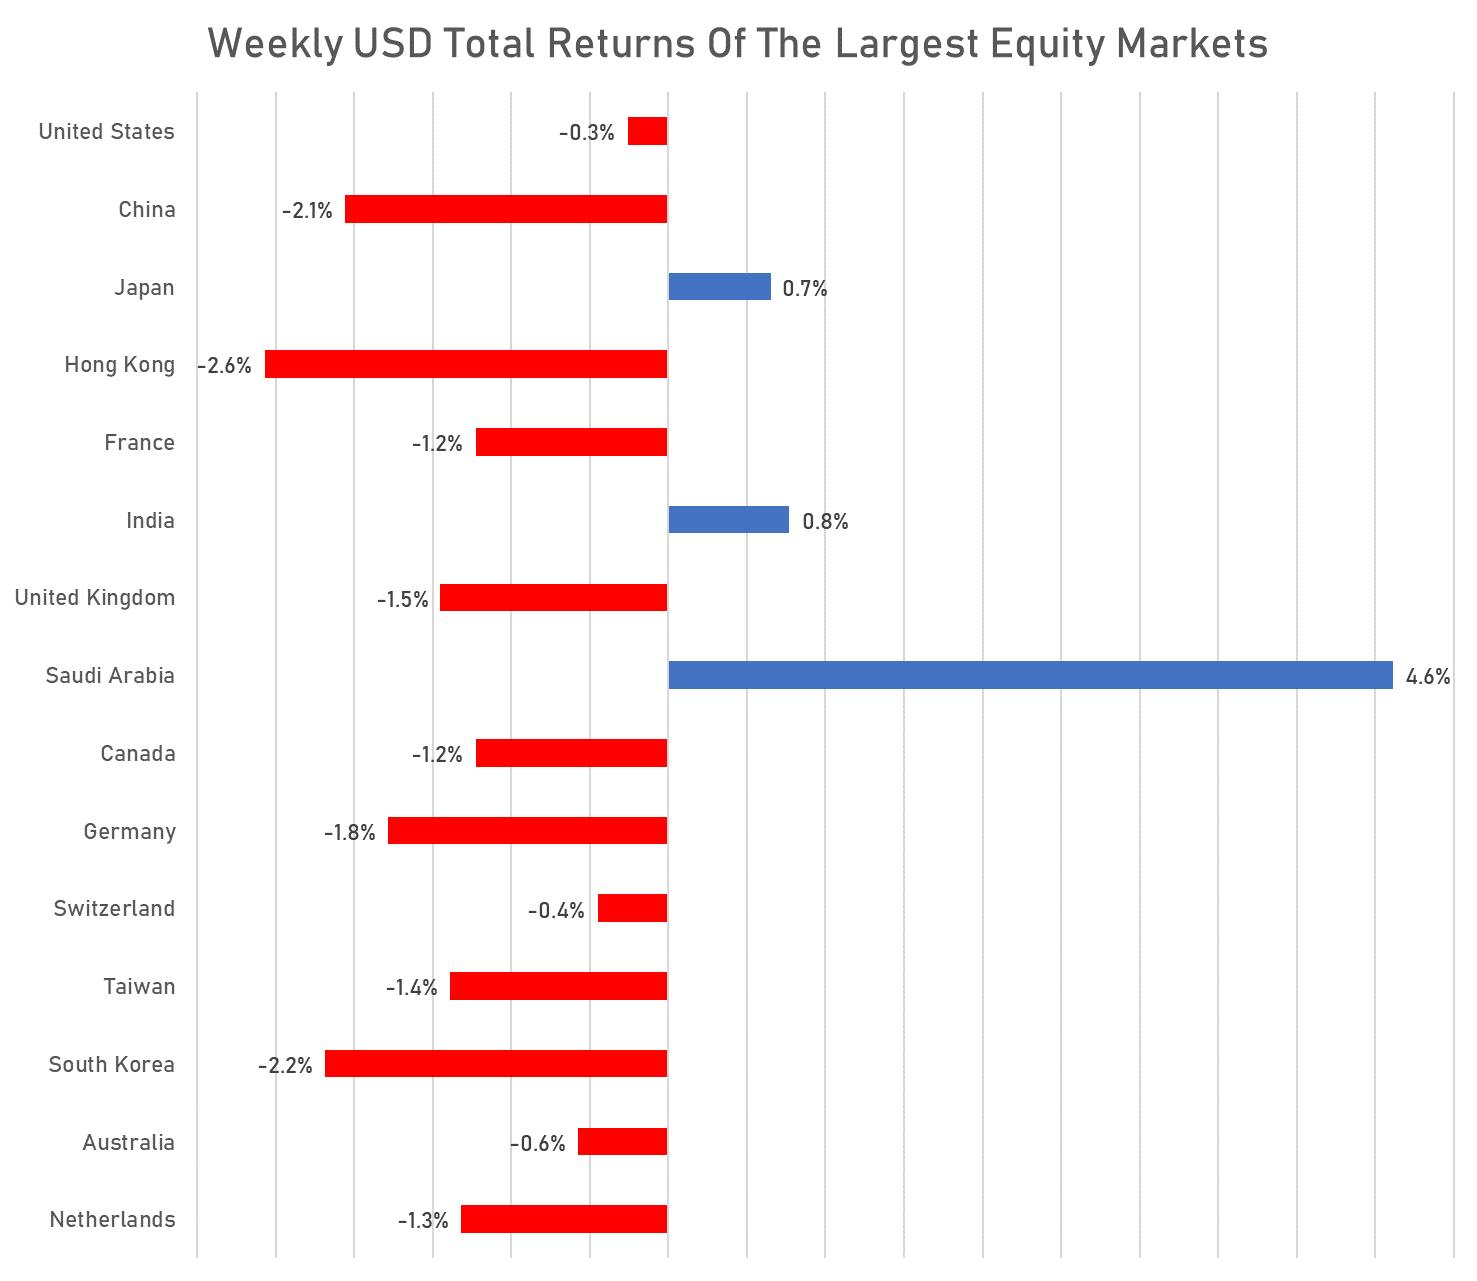
WEEKLY TOTAL RETURNS OF MAJOR GLOBAL EQUITY MARKETS
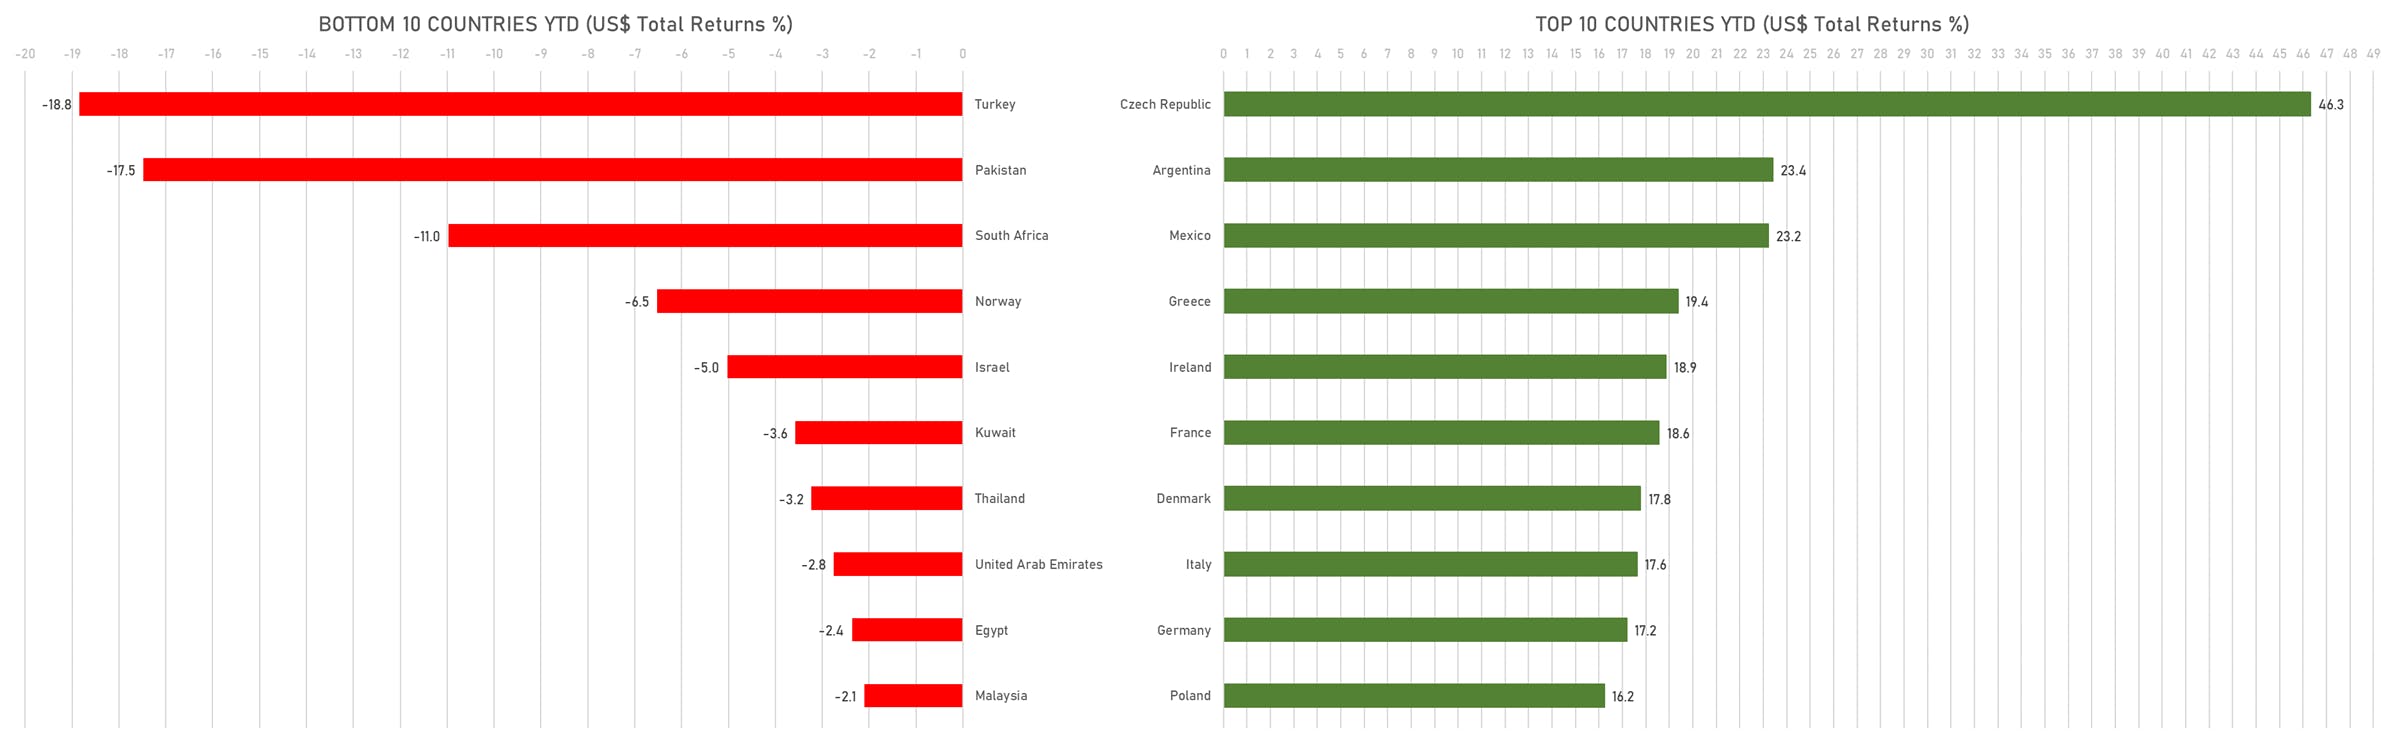
TOP / BOTTOM PERFORMING WORLD MARKETS YTD
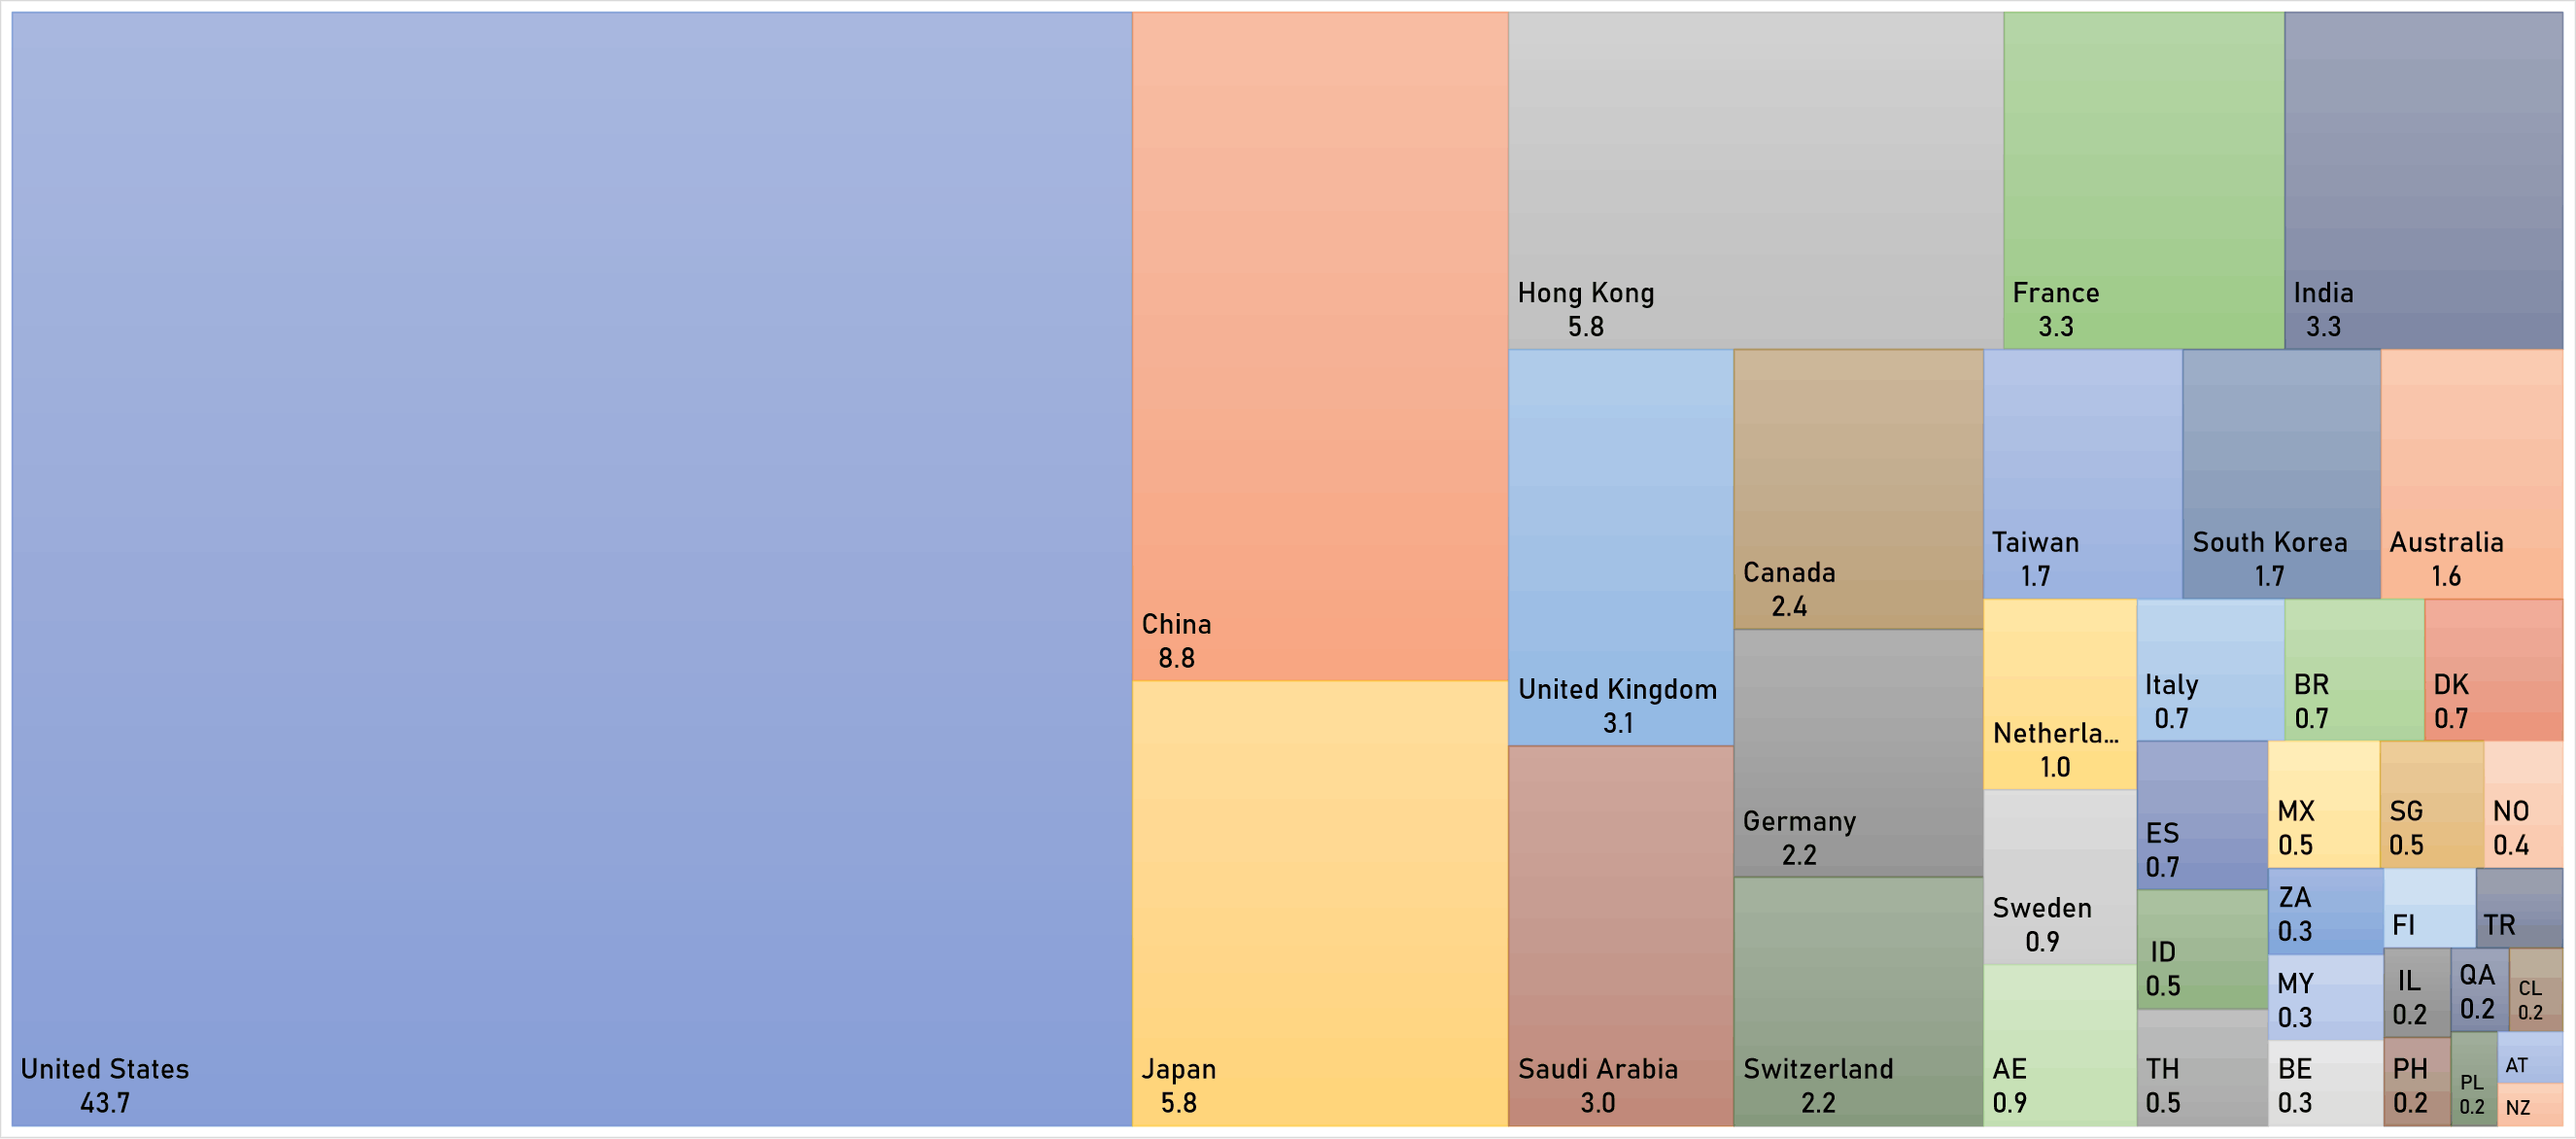
WORLD MARKET CAPITALIZATION (US$ Trillion)