Equities
US Equities Rose 160bp This Week, Still Led By Technology And Internet Services
Before falling on Friday, the S&P 500 toyed with 4,200 this week to make new YTD highs, and could break that level more convincingly in June with a debt ceiling resolution and still very light net speculative positioning
Published ET
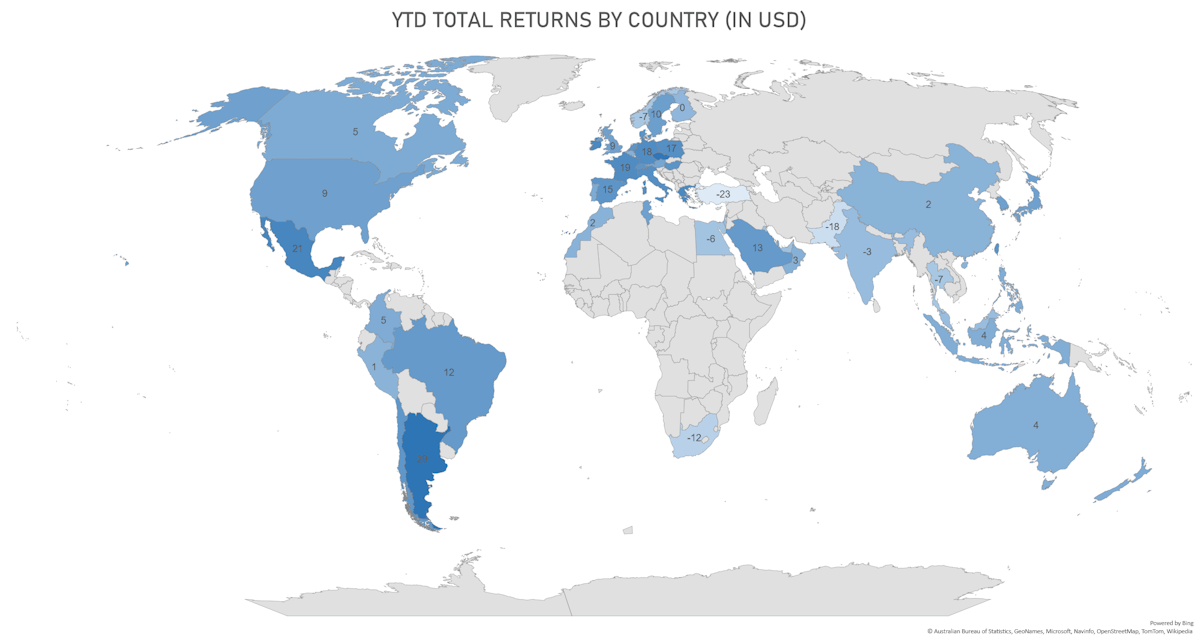
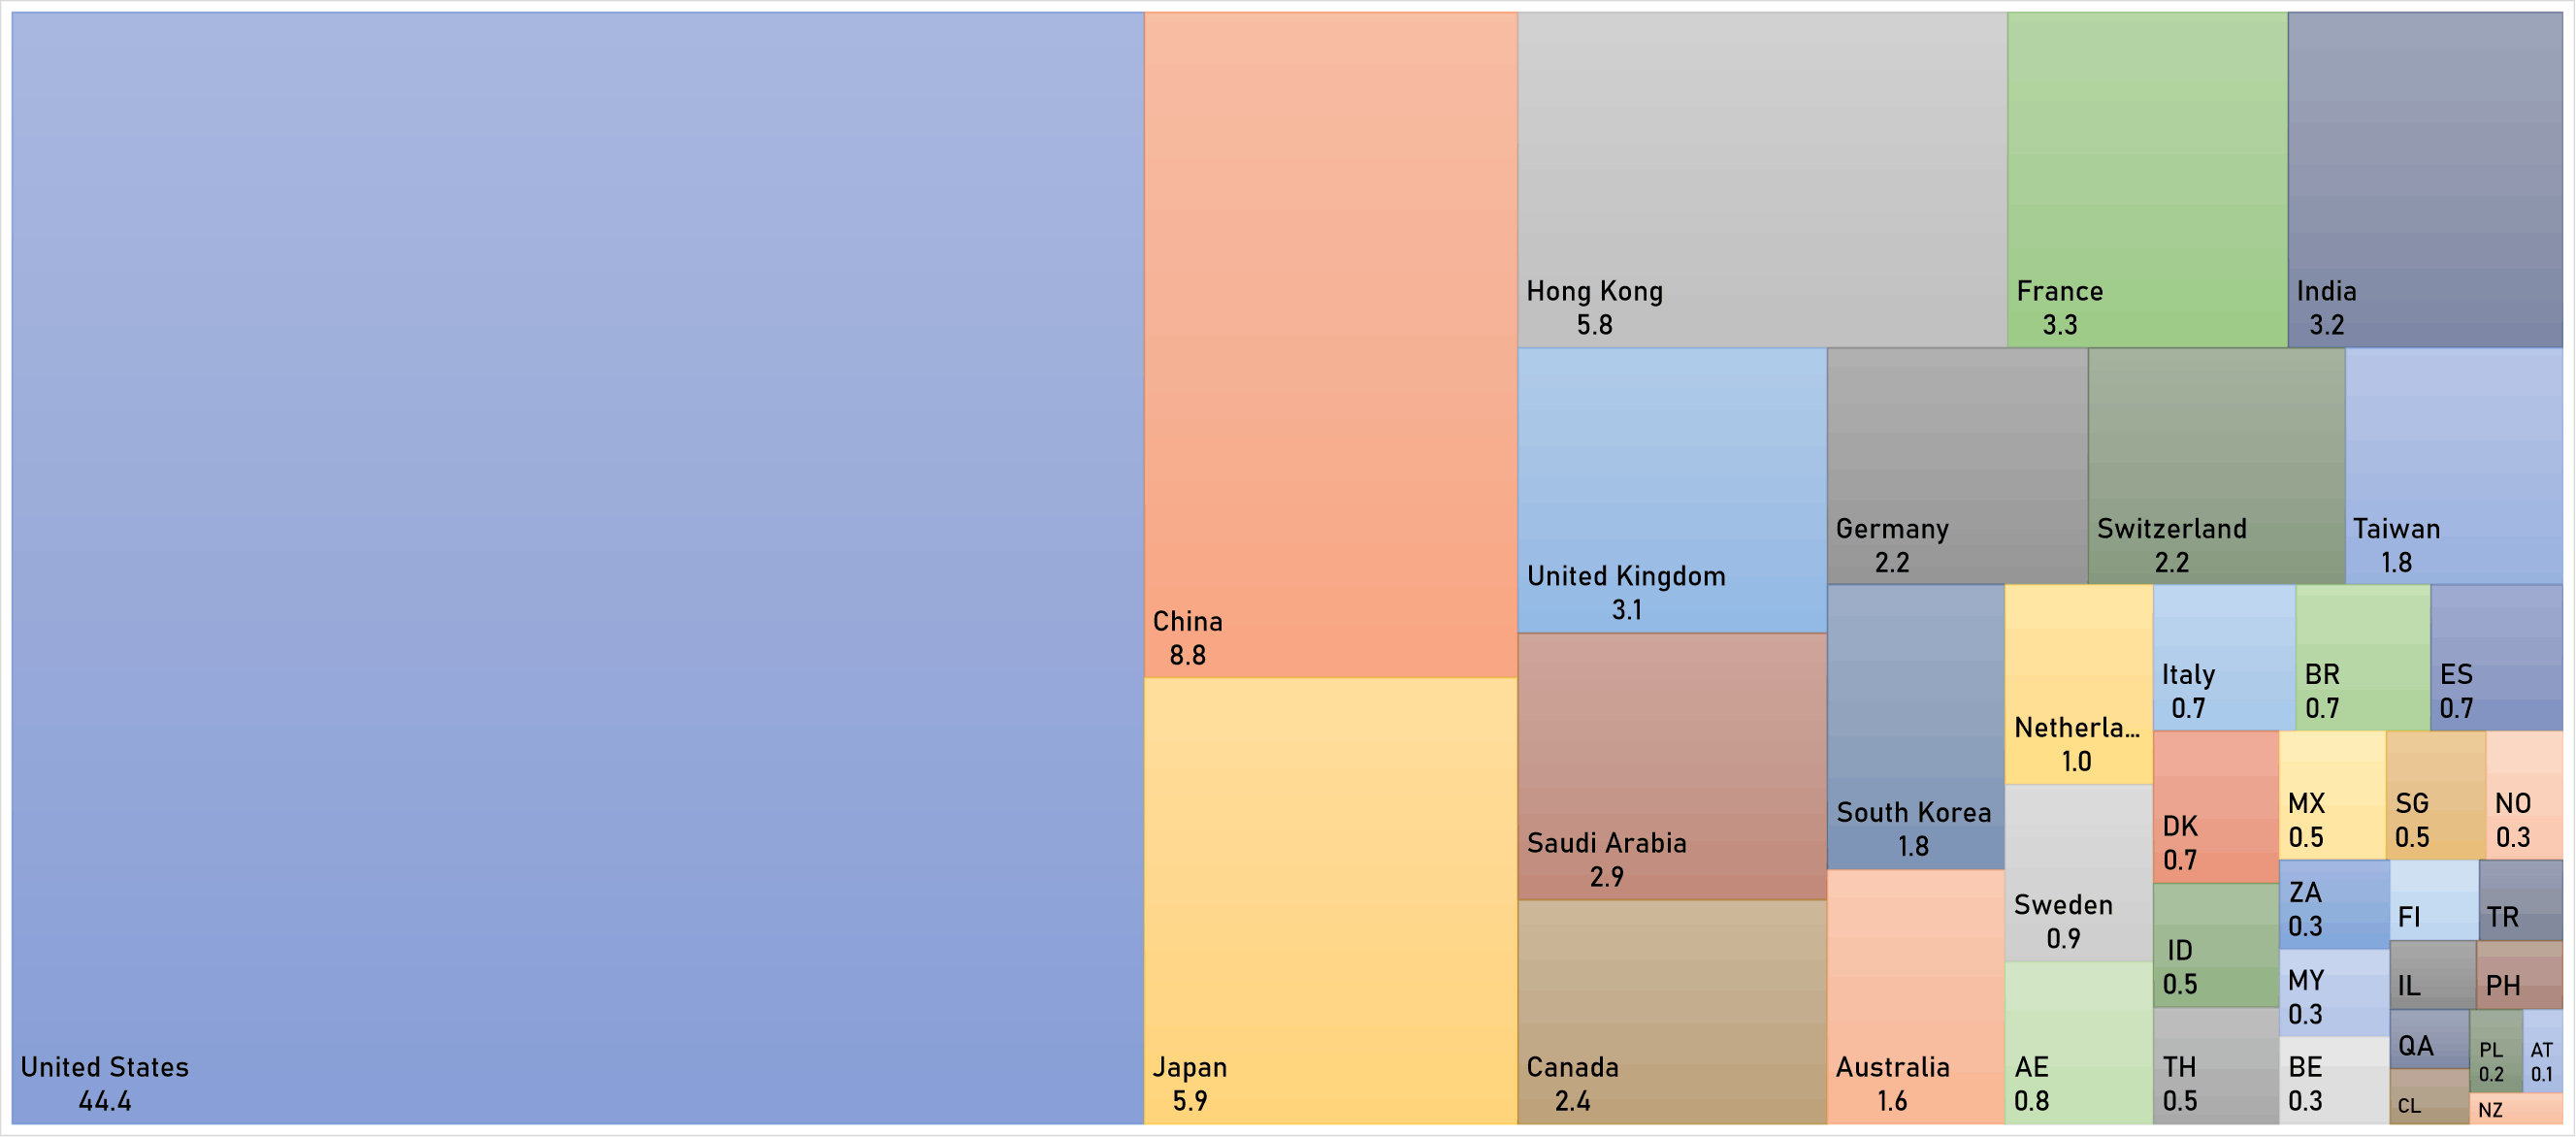
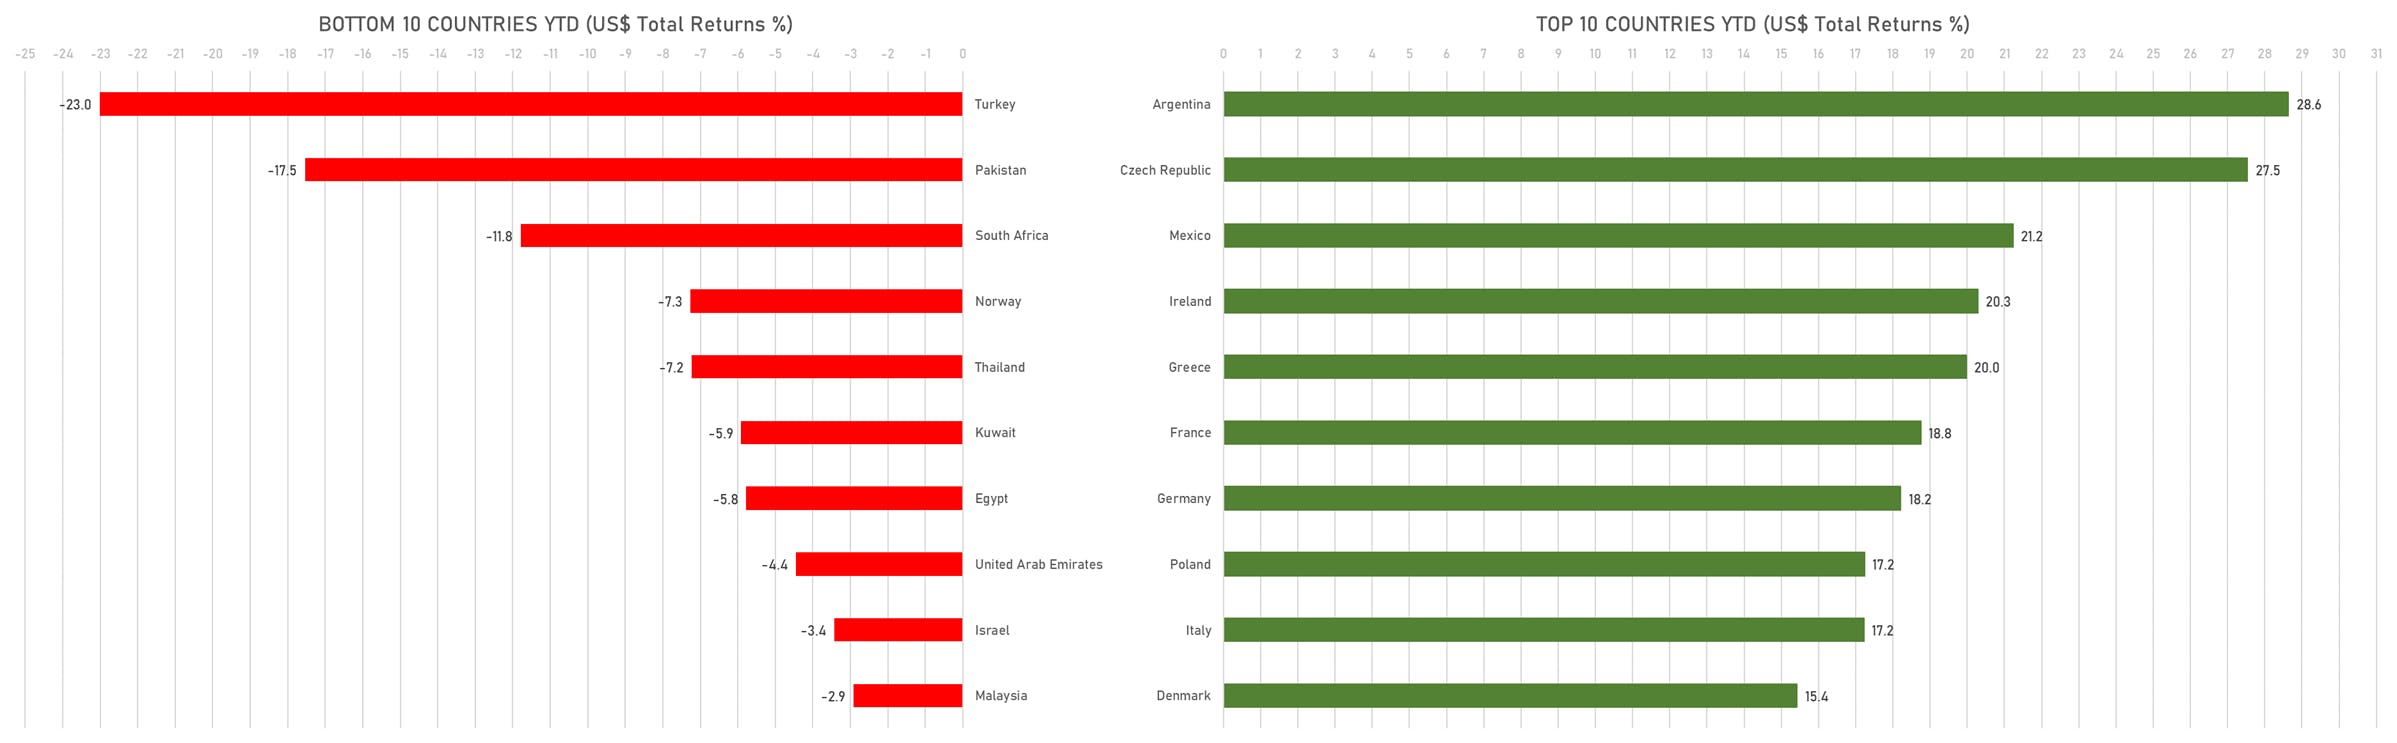
Global Equities USD Total Returns YTD | Sources: phipost.com, FactSet data
DAILY SUMMARY
- Daily performance of US indices: S&P 500 down -0.14%; Nasdaq Composite down -0.24%; Wilshire 5000 up 0.08%
- 39.6% of S&P 500 stocks were up today, with 47.7% of stocks above their 200-day moving average (DMA) and 49.5% above their 50-DMA
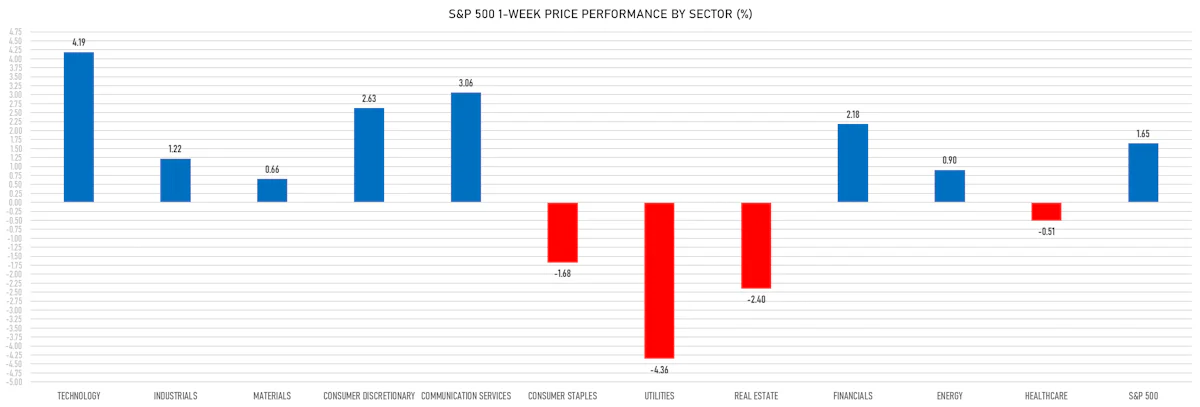
- Top performing sectors in the S&P 500: energy up 0.73% and healthcare up 0.46%
- Bottom performing sectors in the S&P 500: consumer discretionary down -0.84% and communication services down -0.49%
- The number of shares in the S&P 500 traded today was 686m for a total turnover of US$ 68 bn
- The S&P 500 Value Index was down -0.3%, while the S&P 500 Growth Index was unchanged; the S&P small caps index was down -1.1% and mid caps were down -1.1%
- The volume on CME's INX (S&P 500 Index) was 2,352.8m (3-month z-score: -0.2); the 3-month average volume is 2,499.5m and the 12-month range is 903.0 - 5,761.3m
- Daily performance of international indices: Europe Stoxx 600 up 0.66%; UK FTSE 100 up 0.19%; Hang Seng SH-SZ-HK 300 Index down -0.90%; Japan's TOPIX 500 up 0.20%
VOLATILITY TODAY
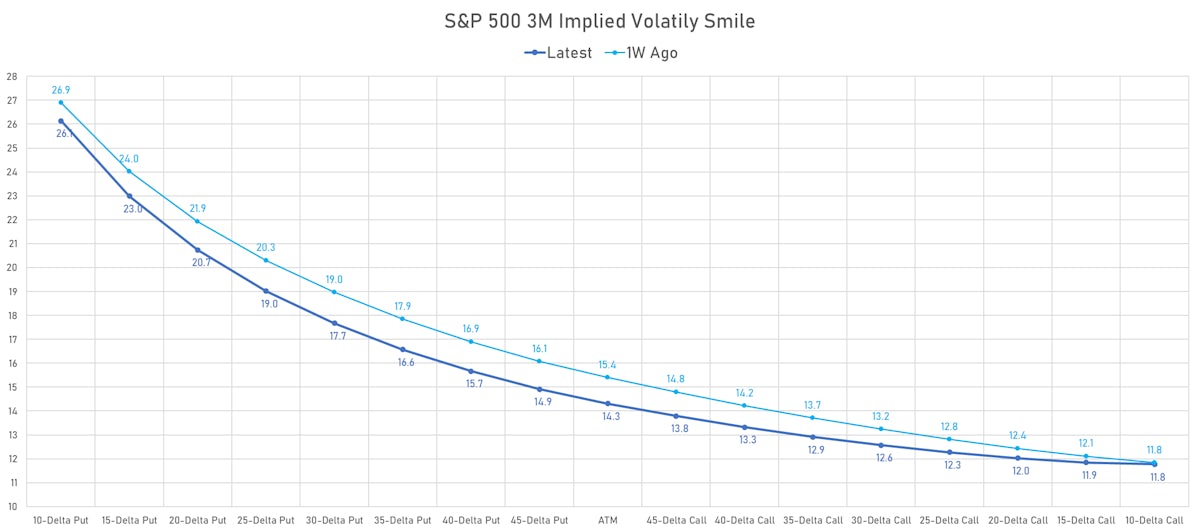
- 3-month at-the-money implied volatility on the S&P 500 at 12.9%, up from 11.9%
- 3-month at-the-money implied volatility on the STOXX Europe 600 at 10.3%, down from 10.8%
TOP WINNERS TODAY
- ARS Pharmaceuticals Inc (SPRY), up 77.9% to $8.57 / YTD price return: -5.7% / 12-Month Price Range: $ 3.09-9.65 / Short interest (% of float): 5.0%; days to cover: 11.1
- Airsculpt Technologies Inc (AIRS), up 37.4% to $7.81 / YTD price return: +81.6% / 12-Month Price Range: $ 2.69-11.26 / Short interest (% of float): 24.1%; days to cover: 18.1
- Blue Bird Corp (BLBD), up 36.3% to $27.05 / YTD price return: +145.8% / 12-Month Price Range: $ 7.14-27.75 / Short interest (% of float): 2.6%; days to cover: 4.5
- AlTi Global, Inc (ALTI), up 28.0% to $4.78 / YTD price return: -42.5% / 12-Month Price Range: $ 3.88-28.49 / Short interest (% of float): 1.4%; days to cover: 3.0
- Arlo Technologies Inc (ARLO), up 27.2% to $9.25 / YTD price return: +155.6% / 12-Month Price Range: $ 2.93-9.69 / Short interest (% of float): 2.9%; days to cover: 3.1
- Ohmyhome Ltd (OMH), up 27.2% to $5.10 / 12-Month Price Range: $ 3.80-57.00 / Short interest (% of float): 0.2%; days to cover: 0.1 (the stock is currently on the short sale restriction list)
- Venus Concept Inc (VERO), up 26.8% to $2.37 / YTD price return: -10.8% / 12-Month Price Range: $ 2.25-12.00 / Short interest (% of float): 0.5%; days to cover: 1.9
- First Solar Inc (FSLR), up 26.5% to $203.53 / YTD price return: +54.7% / 12-Month Price Range: $ 60.77-232.00 / Short interest (% of float): 3.6%; days to cover: 1.6
- Innodata Inc (INOD), up 17.7% to $9.91 / YTD price return: +213.3% / 12-Month Price Range: $ 2.78-10.29 / Short interest (% of float): 1.9%; days to cover: 3.3
- SHENGFENG DEVELOPMENT Ltd (SFWL), up 17.1% to $6.01 / 12-Month Price Range: $ 2.94-12.45 / Short interest (% of float): 0.4%; days to cover: 0.3
BIGGEST LOSERS TODAY
- TOP Financial Group Ltd (TOP), down 29.7% to $9.13 / YTD price return: +87.1% / 12-Month Price Range: $ 3.50-256.44 / Short interest (% of float): 4.8%; days to cover: 0.1 (the stock is currently on the short sale restriction list)
- AVITA Medical Inc (RCEL), down 22.9% to $11.39 / YTD price return: +83.5% / 12-Month Price Range: $ 4.41-16.89 / Short interest (% of float): 10.4%; days to cover: 3.2 (the stock is currently on the short sale restriction list)
- Youdao Inc (DAO), down 20.9% to $5.09 / YTD price return: -6.9% / 12-Month Price Range: $ 3.03-10.00 / Short interest (% of float): 1.1%; days to cover: 1.2 (the stock is currently on the short sale restriction list)
- OraSure Technologies Inc (OSUR), down 18.7% to $5.41 / YTD price return: +24.7% / 12-Month Price Range: $ 2.62-7.82 / Short interest (% of float): 1.8%; days to cover: 2.4 (the stock is currently on the short sale restriction list)
- Harrow Health Inc (HROW), down 18.6% to $21.32 / YTD price return: +49.3% / 12-Month Price Range: $ 5.65-28.25 / Short interest (% of float): 7.8%; days to cover: 5.9 (the stock is currently on the short sale restriction list)
- Immunitybio Inc (IBRX), down 18.3% to $2.97 / YTD price return: -55.0% / 12-Month Price Range: $ 1.21-7.80 / Short interest (% of float): 27.6%; days to cover: 5.9 (the stock is currently on the short sale restriction list)
- Dingdong (Cayman) Ltd (DDL), down 17.8% to $3.04 / YTD price return: -22.2% / 12-Month Price Range: $ 2.43-6.90 / Short interest (% of float): 2.4%; days to cover: 5.7 (the stock is currently on the short sale restriction list)
- Applied Digital Corp (APLD), down 17.5% to $8.57 / YTD price return: +56.5% / 12-Month Price Range: $ .85-8.42 / Short interest (% of float): 4.8%; days to cover: 3.3 (the stock is currently on the short sale restriction list)
- Archer Aviation Inc (ACHR), down 15.6% to $3.25 / YTD price return: +7.0% / 12-Month Price Range: $ 1.62-5.17 / Short interest (% of float): 8.8%; days to cover: 7.2 (the stock is currently on the short sale restriction list)
- Emergent BioSolutions Inc (EBS), down 12.7% to $8.17 / YTD price return: -22.3% / 12-Month Price Range: $ 7.74-40.45 / Short interest (% of float): 13.3%; days to cover: 2.8 (the stock is currently on the short sale restriction list)
TOP S&P 500 PERFORMERS THIS WEEK
- Comerica Inc (CMA), up 19.9% to $38.34 / YTD price return: -42.6% / 12-Month Price Range: $ 28.40-87.01 / Short interest (% of float): 6.6%; days to cover: 1.9
- Zions Bancorporation NA (ZION), up 19.3% to $26.77 / YTD price return: -45.5% / 12-Month Price Range: $ 18.26-59.74 / Short interest (% of float): 10.0%; days to cover: 2.4
- Western Digital Corp (WDC), up 16.0% to $38.32 / YTD price return: +21.5% / 12-Month Price Range: $ 29.74-63.00 / Short interest (% of float): 2.6%; days to cover: 2.1
- Capital One Financial Corp (COF), up 13.4% to $97.93 / YTD price return: +5.3% / 12-Month Price Range: $ 83.93-128.95 / Short interest (% of float): 2.0%; days to cover: 2.5
- Catalent Inc (CTLT), up 13.1% to $37.17 / YTD price return: -17.4% / 12-Month Price Range: $ 31.49-115.26 / Short interest (% of float): 3.5%; days to cover: 1.6
- Bath & Body Works Inc (BBWI), up 12.2% to $37.03 / YTD price return: -12.1% / 12-Month Price Range: $ 25.80-49.54 / Short interest (% of float): 4.2%; days to cover: 2.8
- ServiceNow Inc (NOW), up 12.1% to $510.30 / YTD price return: +31.4% / 12-Month Price Range: $ 337.22-521.01 / Short interest (% of float): 1.8%; days to cover: 2.2
- Micron Technology Inc (MU), up 11.9% to $68.17 / YTD price return: +36.4% / 12-Month Price Range: $ 48.43-75.40 / Short interest (% of float): 2.4%; days to cover: 1.3
- Lam Research Corp (LRCX), up 11.7% to $588.86 / YTD price return: +40.1% / 12-Month Price Range: $ 299.63-600.20 / Short interest (% of float): 1.9%; days to cover: 1.9
- Carnival Corp (CCL), up 11.3% to $10.94 / YTD price return: +35.7% / 12-Month Price Range: $ 6.12-14.19 / Short interest (% of float): 13.3%; days to cover: 3.6
BOTTOM S&P 500 PERFORMERS THIS WEEK
- First Solar Inc (FSLR), down 12.2% to $203.53 / YTD price return: +35.9% / 12-Month Price Range: $ 60.78-231.99 / Short interest (% of float): 3.6%; days to cover: 1.6
- VF Corp (VFC), down 10.4% to $19.07 / YTD price return: -30.9% / 12-Month Price Range: $ 19.07-51.40 / Short interest (% of float): 4.3%; days to cover: 2.7
- Insulet Corp (PODD), down 8.8% to $301.03 / YTD price return: +2.3% / 12-Month Price Range: $ 187.07-335.84 / Short interest (% of float): 4.7%; days to cover: 5.9
- ONEOK Inc (OKE), down 8.2% to $58.52 / YTD price return: -10.9% / 12-Month Price Range: $ 50.50-71.56 / Short interest (% of float): 2.0%; days to cover: 3.9
- Edison International (EIX), down 7.4% to $68.24 / YTD price return: +7.3% / 12-Month Price Range: $ 54.51-74.91 / Short interest (% of float): 2.2%; days to cover: 4.9
- Digital Realty Trust Inc (DLR), down 6.5% to $90.75 / YTD price return: -9.5% / 12-Month Price Range: $ 85.82-141.77 / Short interest (% of float): 5.4%; days to cover: 5.0
- Newell Brands Inc (NWL), down 6.3% to $8.69 / YTD price return: -33.6% / 12-Month Price Range: $ 8.69-21.88
- Entergy Corp (ETR), down 6.2% to $100.55 / YTD price return: -10.6% / 12-Month Price Range: $ 94.94-122.46 / Short interest (% of float): 1.0%; days to cover: 1.8
- ETSY Inc (ETSY), down 5.9% to $89.10 / YTD price return: -25.6% / 12-Month Price Range: $ 67.06-149.84 / Short interest (% of float): 11.6%; days to cover: 5.2
- AES Corp (AES), down 5.9% to $20.81 / YTD price return: -27.6% / 12-Month Price Range: $ 18.62-29.87 / Short interest (% of float): 1.9%; days to cover: 2.8
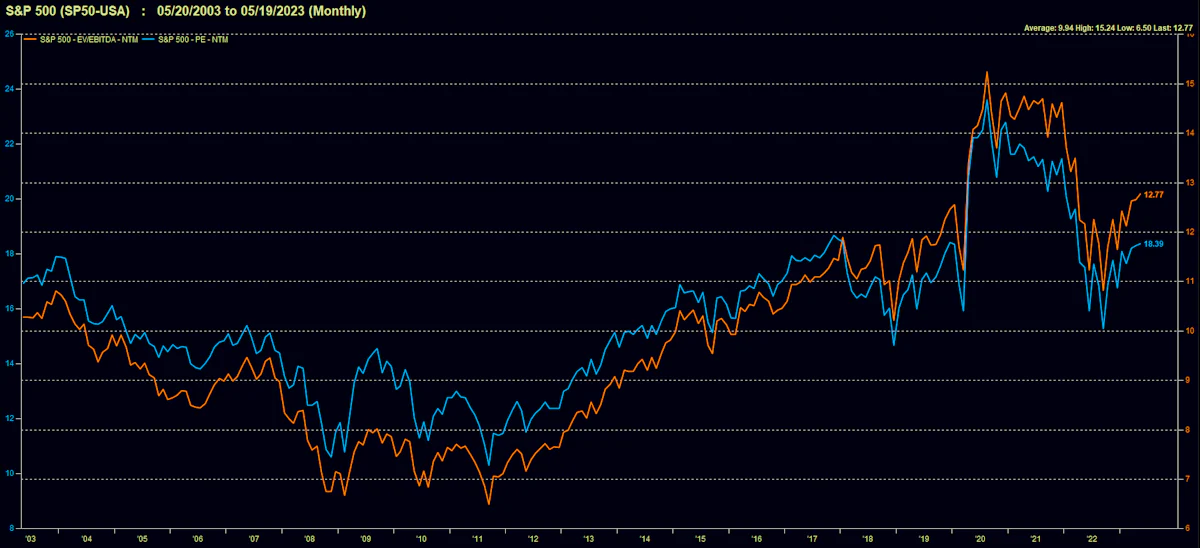
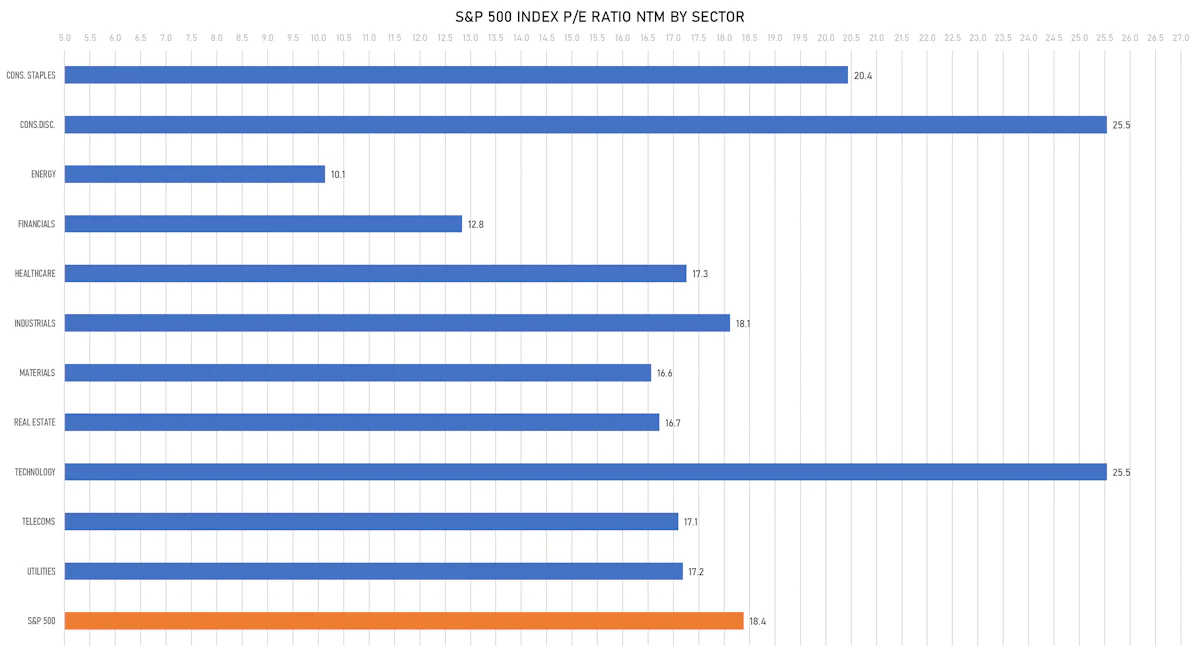
VALUATION MULTIPLES BY SECTORS
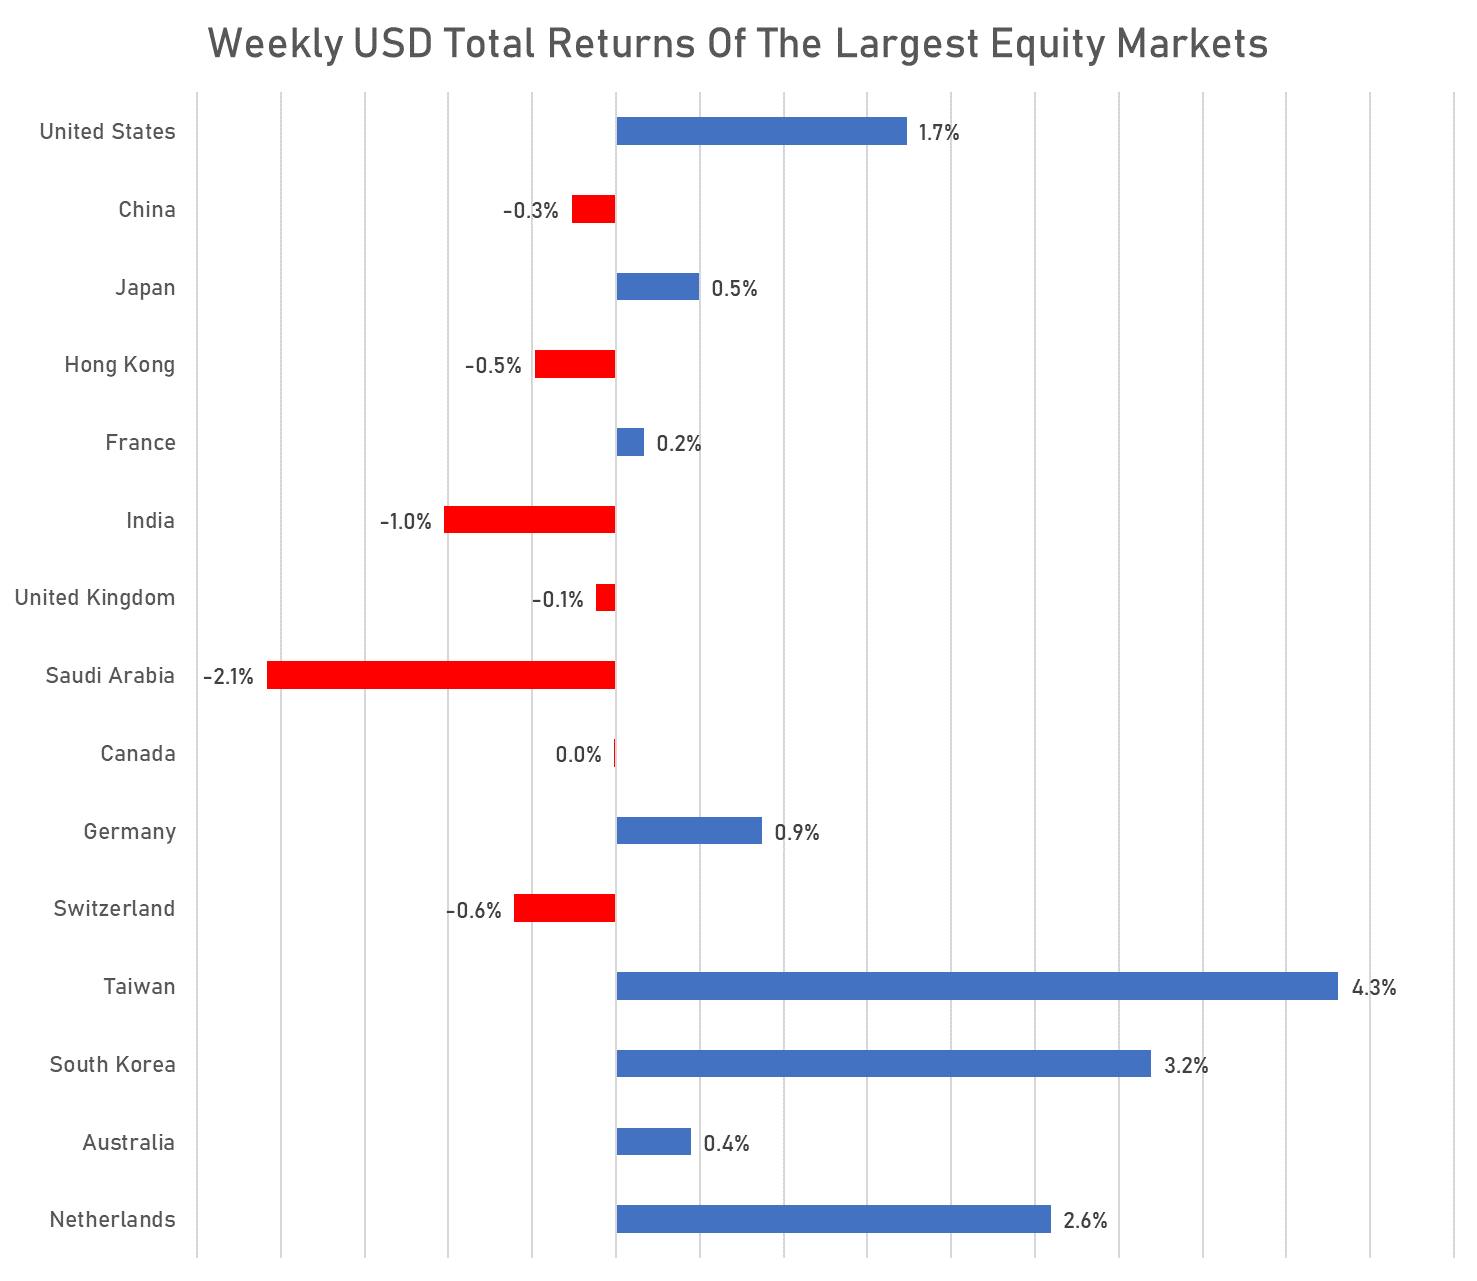
WEEKLY TOTAL RETURNS OF MAJOR GLOBAL EQUITY MARKETS
TOP / BOTTOM PERFORMING WORLD MARKETS YTD
WORLD MARKET CAPITALIZATION (US$ Trillion)