Equities
US Equities Have Terrible Breadth: NDX Up 8% Month-To-Date, Equal-Weighted S&P 500 Down 3%
Active managers are still very lightly positioned, which could lead to further gains in the short term, with continued strength in economic data and a new debt ceiling deal
Published ET
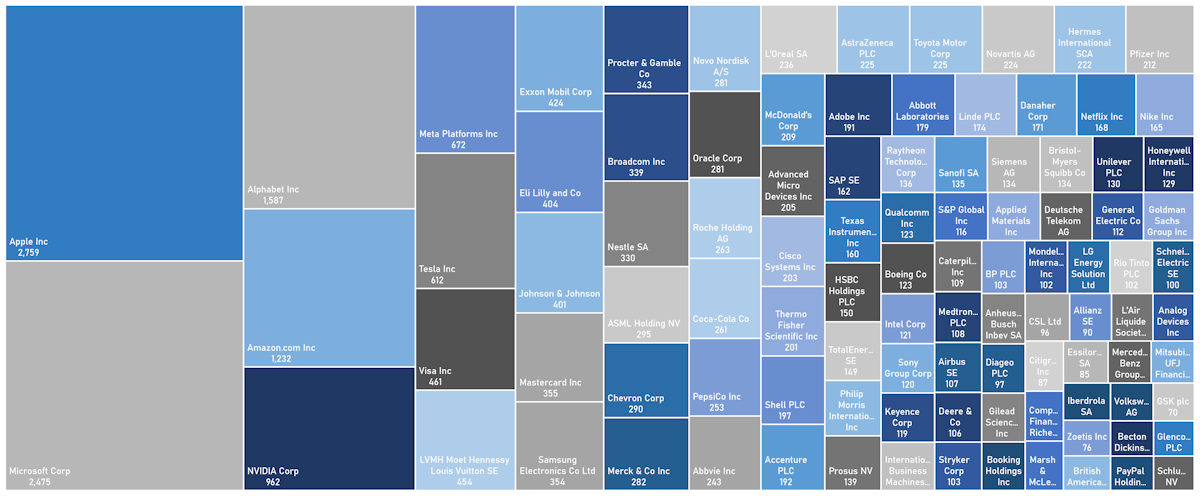
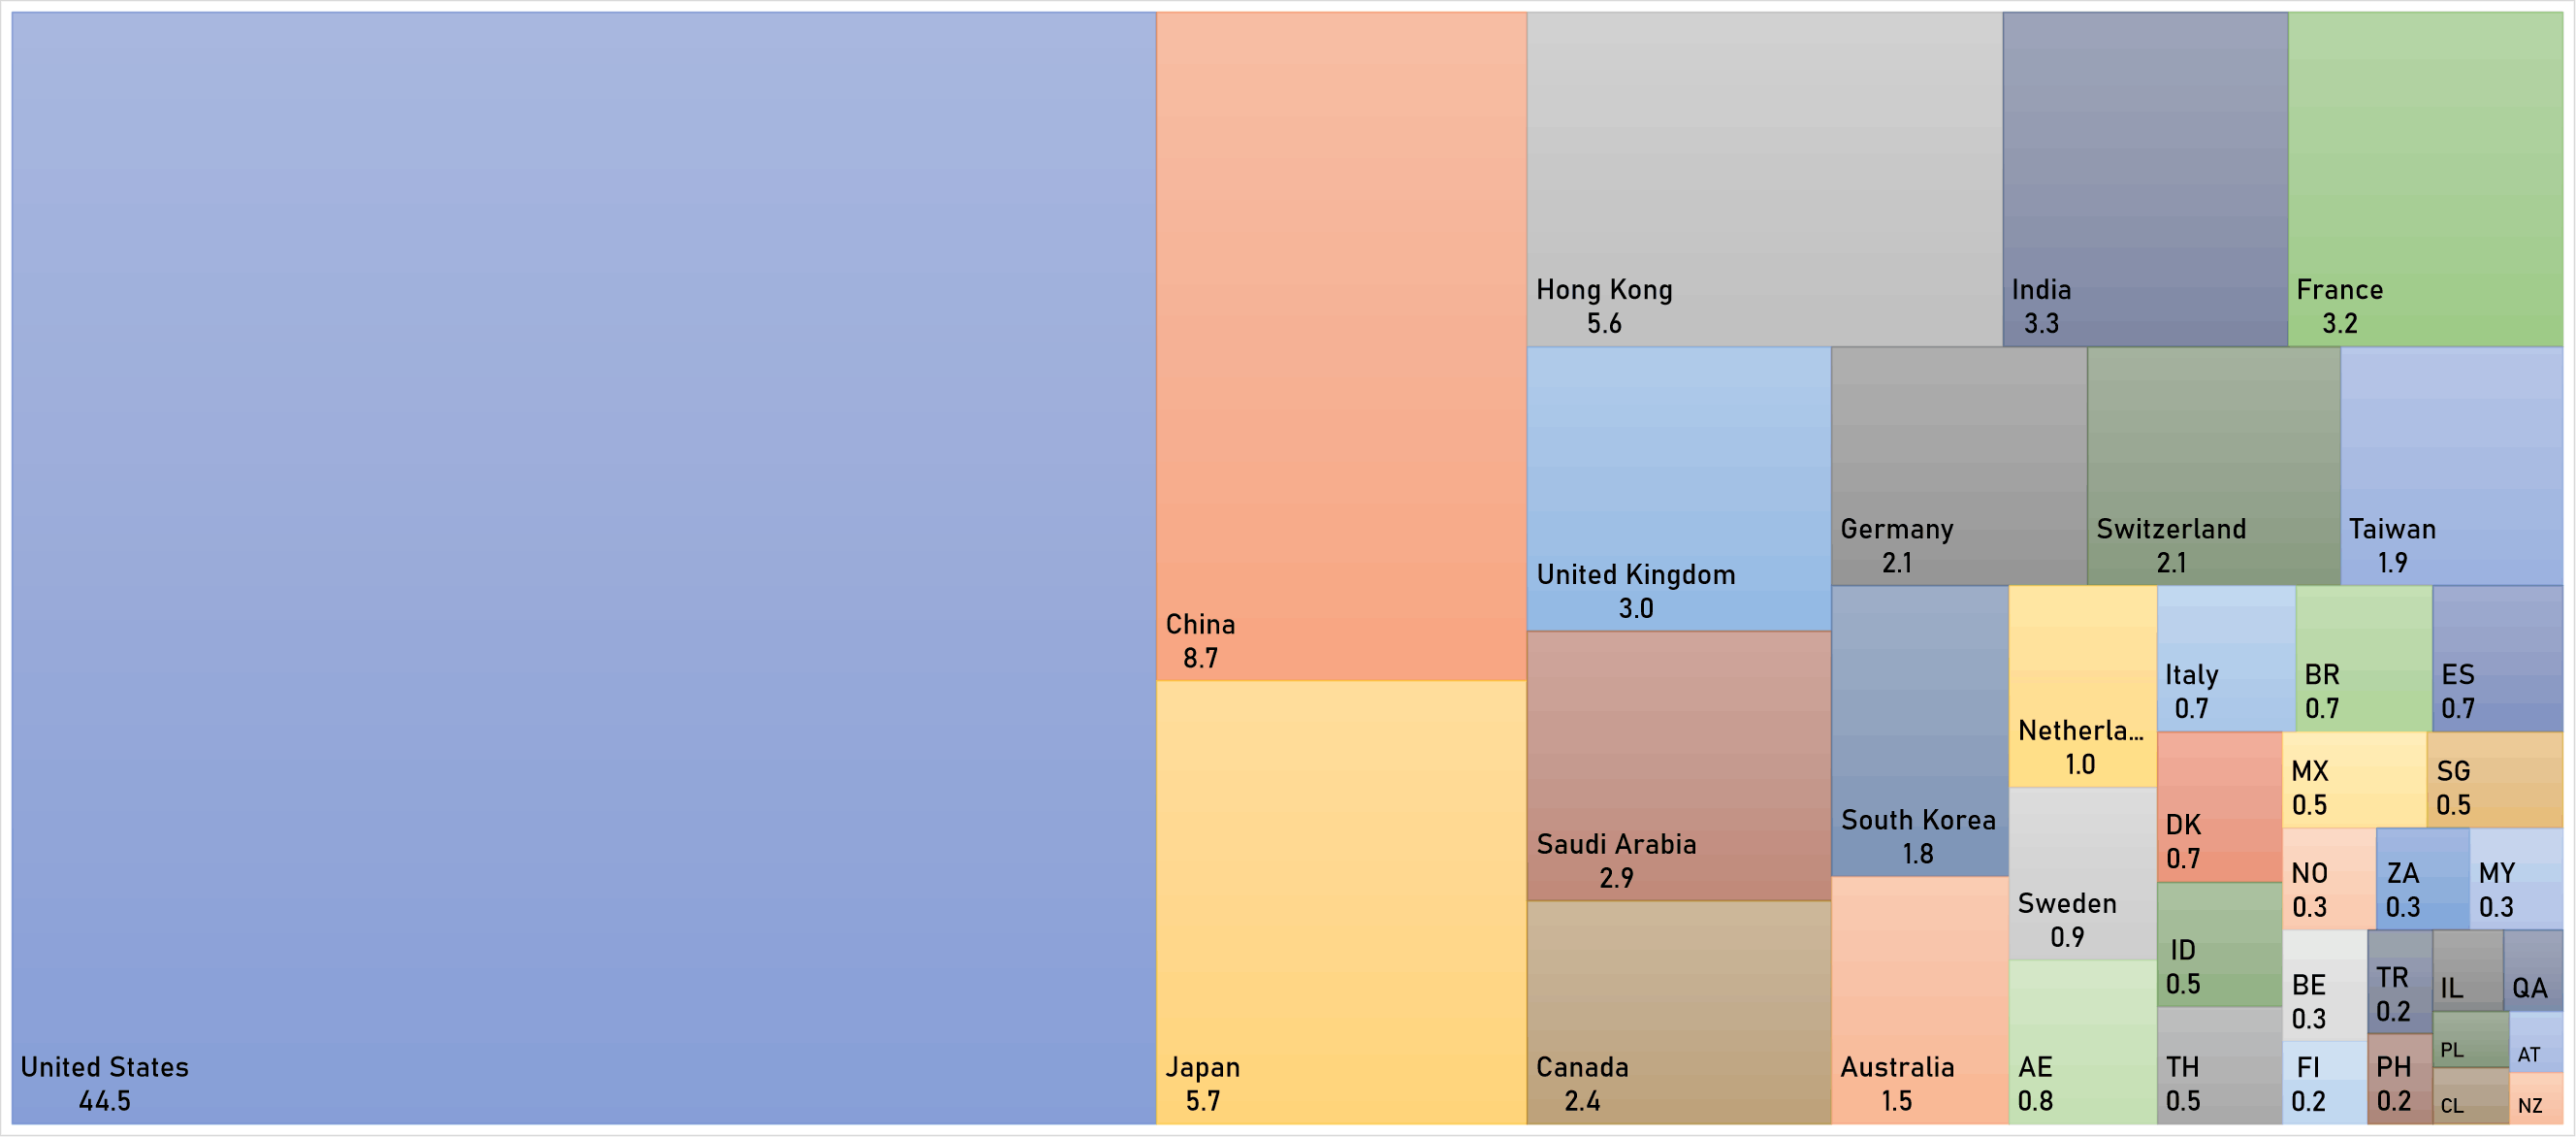
FTSE Global 100 Constituents, Market Cap in US$ bn | Sources: phipost.com, Refinitiv data
DAILY SUMMARY
- Daily performance of US indices: S&P 500 up 1.30%; Nasdaq Composite up 2.19%; Wilshire 5,000 up 1.10%
- 68.4% of S&P 500 stocks were up today, with 41.4% of stocks above their 200-day moving average (DMA) and 35.6% above their 50-DMA
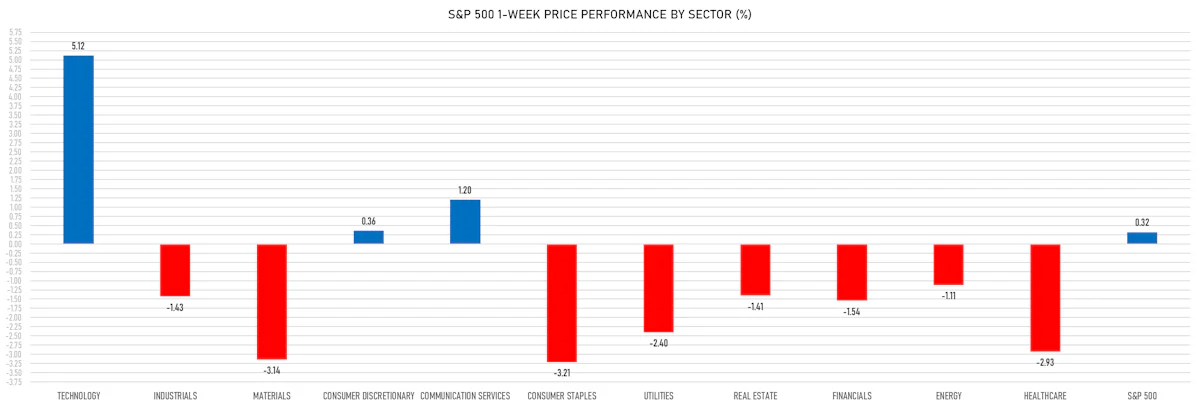
- Top performing sectors in the S&P 500: technology up 2.68% and consumer discretionary up 2.38%
- Bottom performing sectors in the S&P 500: energy down -0.37% and healthcare down -0.17%
- The number of shares in the S&P 500 traded today was 697m for a total turnover of US$ 79 bn
- The S&P 500 Value Index Index was up 1.3%, while the S&P 500 Growth Index Index was up 1.3%; the S&P small caps index was up 1.1% and mid caps were up 1.2%
- The volume on CME's INX (S&P 500 Index) was 2591.8m (3-month z-score: 0.1); the 3-month average volume is 2513.2m and the 12-month range is 903.0 - 5761.3m
- Daily performance of international indices: Europe Stoxx 600 up 1.15%; UK FTSE 100 up 0.74%; Hang Seng SH-SZ-HK 300 Index down -0.16%; Japan's TOPIX 500 up 0.04%
VOLATILITY TODAY
- 3-month at-the-money implied volatility on the S&P 500 at 13.4%, down from 14.6%
- 3-month at-the-money implied volatility on the STOXX Europe 600 at 12.1%, down from 13.4%
TOP WINNERS TODAY
- Marvell Technology Inc (MRVL), up 32.4% to $65.51 / YTD price return: +76.9% / 12-Month Price Range: $ 33.75-65.51 / Short interest (% of float): 3.4%; days to cover: 2.8
- Iteos Therapeutics Inc (ITOS), up 29.9% to $18.05 / YTD price return: -7.6% / 12-Month Price Range: $ 12.52-28.05 / Short interest (% of float): 5.0%; days to cover: 8.1
- PDS Biotechnology Corp (PDSB), up 27.4% to $8.56 / YTD price return: -35.2% / 12-Month Price Range: $ 2.89-13.65 / Short interest (% of float): 7.1%; days to cover: 7.5
- Arcus Biosciences Inc (RCUS), up 25.9% to $22.03 / YTD price return: +6.5% / 12-Month Price Range: $ 15.70-36.13 / Short interest (% of float): 16.7%; days to cover: 10.8
- Sify Technologies Ltd (SIFY), up 22.5% to $1.58 / YTD price return: +37.2% / 12-Month Price Range: $ 1.05-2.46 / Short interest (% of float): 0.0%; days to cover: 0.2
- Mediaalpha Inc (MAX), up 22.1% to $9.28 / YTD price return: -6.7% / 12-Month Price Range: $ 5.08-17.01 / Short interest (% of float): 2.4%; days to cover: 2.4
- PDD Holdings Inc (PDD), up 19.0% to $71.42 / YTD price return: -12.4% / 12-Month Price Range: $ 38.80-106.38 / Short interest (% of float): 2.1%; days to cover: 4.0
- RingCentral Inc (RNG), up 17.9% to $34.78 / YTD price return: -1.8% / 12-Month Price Range: $ 25.32-68.54 / Short interest (% of float): 7.2%; days to cover: 3.0
- Innodata Inc (INOD), up 16.3% to $11.30 / YTD price return: +281.1% / 12-Month Price Range: $ 2.78-11.30 / Short interest (% of float): 3.0%; days to cover: 3.2
- C3.ai Inc (AI), up 15.9% to $32.94 / YTD price return: +194.4% / 12-Month Price Range: $ 10.16-34.68 / Short interest (% of float): 27.0%; days to cover: 1.3
BIGGEST LOSERS TODAY
- Canaan Inc (CAN), down 26.7% to $1.89 / YTD price return: -8.3% / 12-Month Price Range: $ 1.87-4.54 / Short interest (% of float): 4.8%; days to cover: 4.4 (the stock is currently on the short sale restriction list)
- Tilray Brands Inc (TLRY), down 21.2% to $1.86 / YTD price return: -30.9% / 12-Month Price Range: $ 1.86-5.12 / Short interest (% of float): 8.1%; days to cover: 4.5 (the stock is currently on the short sale restriction list)
- Dlocal Ltd (DLO), down 17.3% to $11.41 / YTD price return: -26.7% / 12-Month Price Range: $ 9.03-33.63 / Short interest (% of float): 11.3%; days to cover: 4.7 (the stock is currently on the short sale restriction list)
- Virgin Galactic Holdings Inc (SPCE), down 16.5% to $3.38 / YTD price return: -2.9% / 12-Month Price Range: $ 2.98-8.56 / Short interest (% of float): 23.9%; days to cover: 6.1 (the stock is currently on the short sale restriction list)
- PagSeguro Digital Ltd (PAGS), down 13.9% to $10.44 / YTD price return: +19.5% / 12-Month Price Range: $ 7.51-19.49 / Short interest (% of float): 3.1%; days to cover: 1.5 (the stock is currently on the short sale restriction list)
- Domo Inc (DOMO), down 13.7% to $12.80 / YTD price return: -10.1% / 12-Month Price Range: $ 11.35-35.43 / Short interest (% of float): 4.7%; days to cover: 2.7 (the stock is currently on the short sale restriction list)
- Ulta Beauty Inc (ULTA), down 13.4% to $420.27 / YTD price return: -10.4% / 12-Month Price Range: $ 360.58-556.60 (the stock is currently on the short sale restriction list)
- Beauty Health Co (SKIN), down 13.1% to $8.40 / YTD price return: -7.7% / 12-Month Price Range: $ 8.25-16.02 / Short interest (% of float): 16.0%; days to cover: 11.7 (the stock is currently on the short sale restriction list)
- Design Therapeutics Inc (DSGN), down 11.8% to $6.13 / YTD price return: -40.3% / 12-Month Price Range: $ 4.90-26.30 / Short interest (% of float): 21.2%; days to cover: 23.6 (the stock is currently on the short sale restriction list)
- Hibbett Inc (HIBB), down 11.3% to $39.19 / YTD price return: -42.6% / 12-Month Price Range: $ 39.19-75.38 / Short interest (% of float): 12.5%; days to cover: 7.9 (the stock is currently on the short sale restriction list)
TOP S&P 500 PERFORMERS THIS WEEK
- Booking Holdings Inc (BKNG), up 20350.9% to $2,591.13 / YTD price return: +31,576.4% / 12-Month Price Range: $ 1,621.49-2,786.07 / Short interest (% of float): 1.8%; days to cover: 2.3
- NVIDIA Corp (NVDA), up 24.6% to $389.46 / YTD price return: +166.5% / 12-Month Price Range: $ 108.14-394.80 / Short interest (% of float): 1.2%; days to cover: 0.8
- Monolithic Power Systems Inc (MPWR), up 20.6% to $520.92 / YTD price return: +47.3% / 12-Month Price Range: $ 303.30-540.95 / Short interest (% of float): 4.5%; days to cover: 4.1
- Advanced Micro Devices Inc (AMD), up 20.0% to $127.03 / YTD price return: +96.1% / 12-Month Price Range: $ 54.58-127.03 / Short interest (% of float): 2.1%; days to cover: 0.6
- Broadcom Inc (AVGO), up 19.1% to $812.73 / YTD price return: +45.4% / 12-Month Price Range: $ 415.35-812.73 / Short interest (% of float): 1.6%; days to cover: 3.8
- Arista Networks Inc (ANET), up 18.4% to $170.35 / YTD price return: +40.4% / 12-Month Price Range: $ 89.13-171.43 / Short interest (% of float): 1.9%; days to cover: 1.6
- Adobe Inc (ADBE), up 11.9% to $415.39 / YTD price return: +23.4% / 12-Month Price Range: $ 274.80-451.09 / Short interest (% of float): 1.3%; days to cover: 2.2
- Digital Realty Trust Inc (DLR), up 9.0% to $98.89 / YTD price return: -1.4% / 12-Month Price Range: $ 85.82-141.77 / Short interest (% of float): 5.6%; days to cover: 6.2
- Synopsys Inc (SNPS), up 8.9% to $444.73 / YTD price return: +39.3% / 12-Month Price Range: $ 267.00-444.73 / Short interest (% of float): 0.9%; days to cover: 2.1
- KLA Corp (KLAC), up 8.9% to $461.19 / YTD price return: +22.3% / 12-Month Price Range: $ 250.74-461.19 / Short interest (% of float): 1.6%; days to cover: 2.3
BOTTOM S&P 500 PERFORMERS THIS WEEK
- Ulta Beauty Inc (ULTA), down 14.4% to $420.27 / YTD price return: -10.4% / 12-Month Price Range: $ 360.75-556.00 / Short interest (% of float): 4.3%; days to cover: 3.8 (the stock is currently on the short sale restriction list)
- Dollar Tree Inc (DLTR), down 11.0% to $142.45 / YTD price return: +.7% / 12-Month Price Range: $ 129.26-175.64 / Short interest (% of float): 3.0%; days to cover: 4.2
- Insulet Corp (PODD), down 9.4% to $272.63 / YTD price return: -7.4% / 12-Month Price Range: $ 192.44-335.84 / Short interest (% of float): 4.7%; days to cover: 6.3
- Medtronic PLC (MDT), down 8.8% to $81.46 / YTD price return: +4.8% / 12-Month Price Range: $ 75.77-101.39 / Short interest (% of float): 0.8%; days to cover: 1.9
- Target Corp (TGT), down 8.8% to $138.93 / YTD price return: -6.8% / 12-Month Price Range: $ 137.23-183.85 / Short interest (% of float): 2.1%; days to cover: 3.6
- Wynn Resorts Ltd (WYNN), down 8.3% to $101.13 / YTD price return: +22.6% / 12-Month Price Range: $ 50.22-117.85 / Short interest (% of float): 7.4%; days to cover: 3.0
- Zoetis Inc (ZTS), down 8.2% to $164.74 / YTD price return: +12.4% / 12-Month Price Range: $ 124.46-187.73 / Short interest (% of float): 0.8%; days to cover: 2.2
- DENTSPLY SIRONA Inc (XRAY), down 8.0% to $36.96 / YTD price return: +16.1% / 12-Month Price Range: $ 26.48-43.04 / Short interest (% of float): 3.9%; days to cover: 4.8
- Analog Devices Inc (ADI), down 7.3% to $176.53 / YTD price return: +7.6% / 12-Month Price Range: $ 133.48-198.14 / Short interest (% of float): 1.2%; days to cover: 2.2
- Autozone Inc (AZO), down 7.3% to $2,460.79 / YTD price return: -.2% / 12-Month Price Range: $ 1,962.38-2,750.00 / Short interest (% of float): 1.6%; days to cover: 2.3
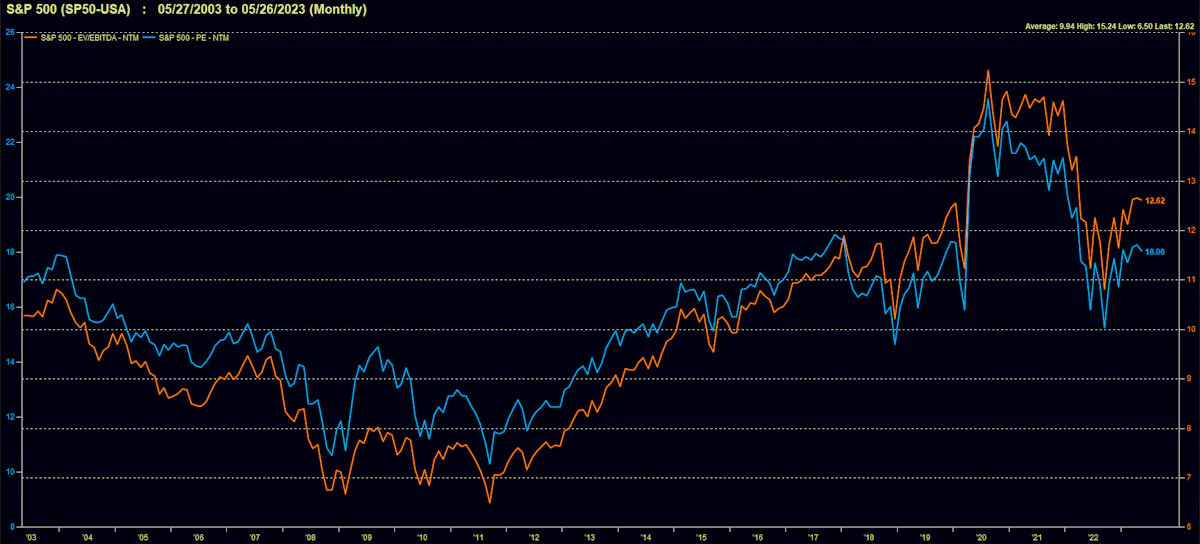
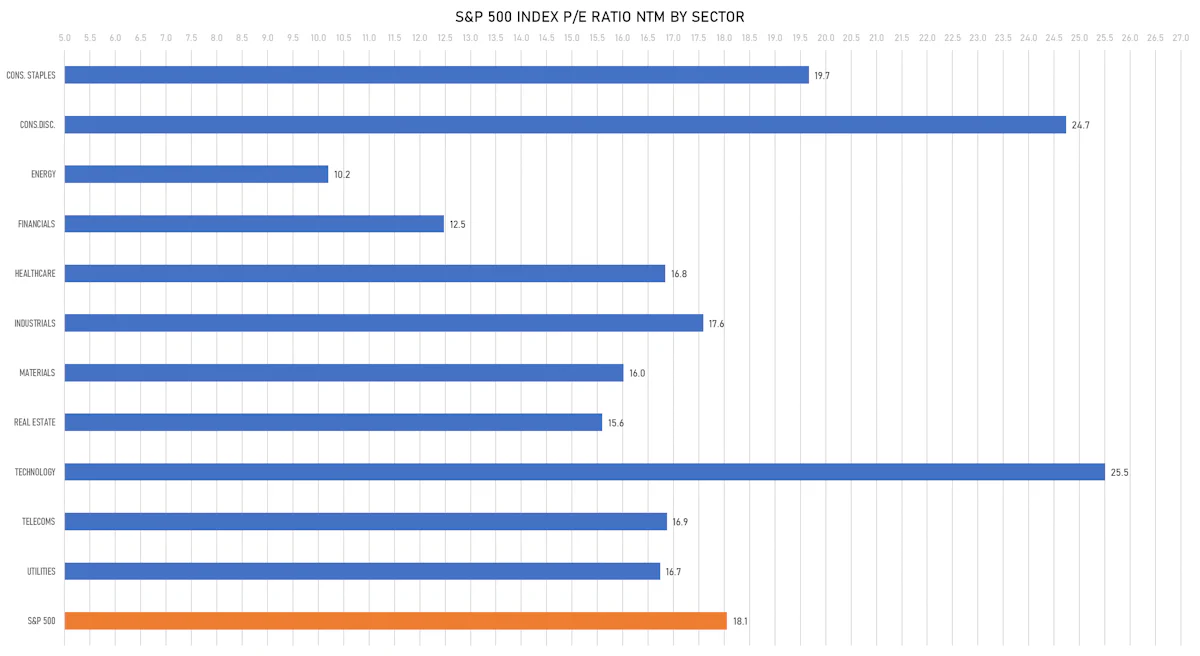
VALUATION MULTIPLES BY SECTORS
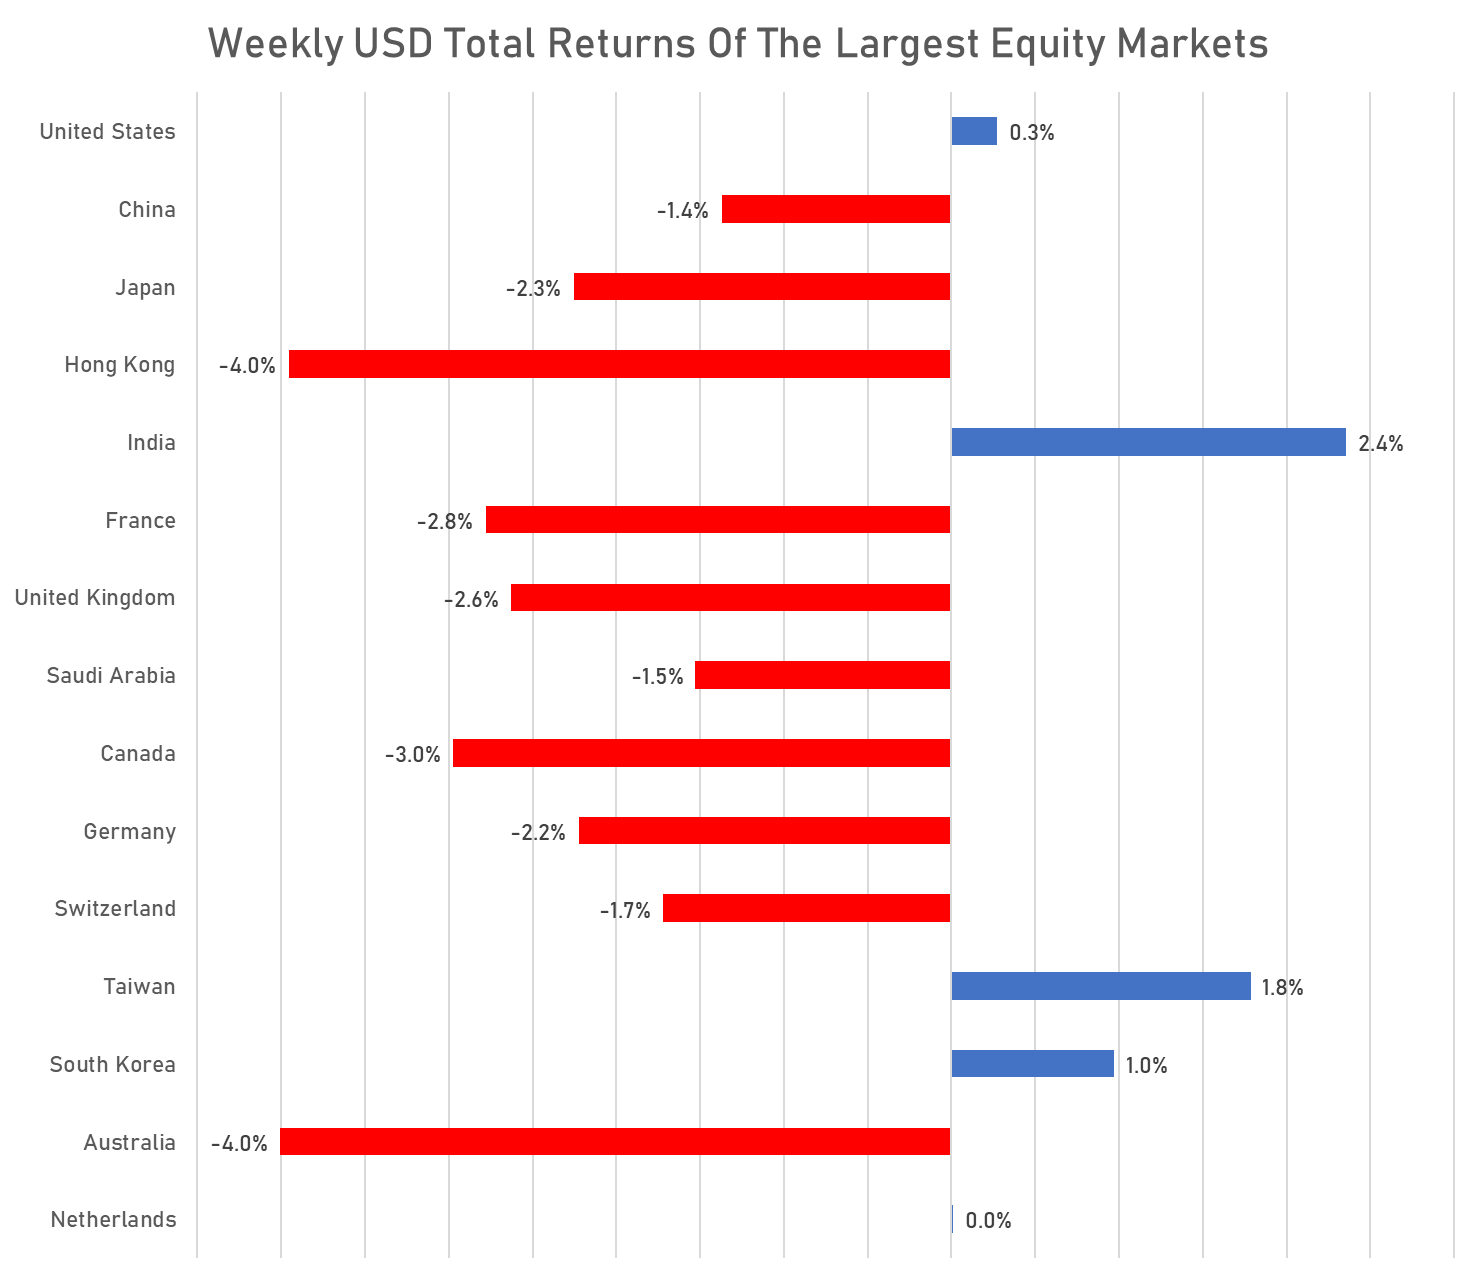
WEEKLY TOTAL RETURNS OF MAJOR GLOBAL EQUITY MARKETS
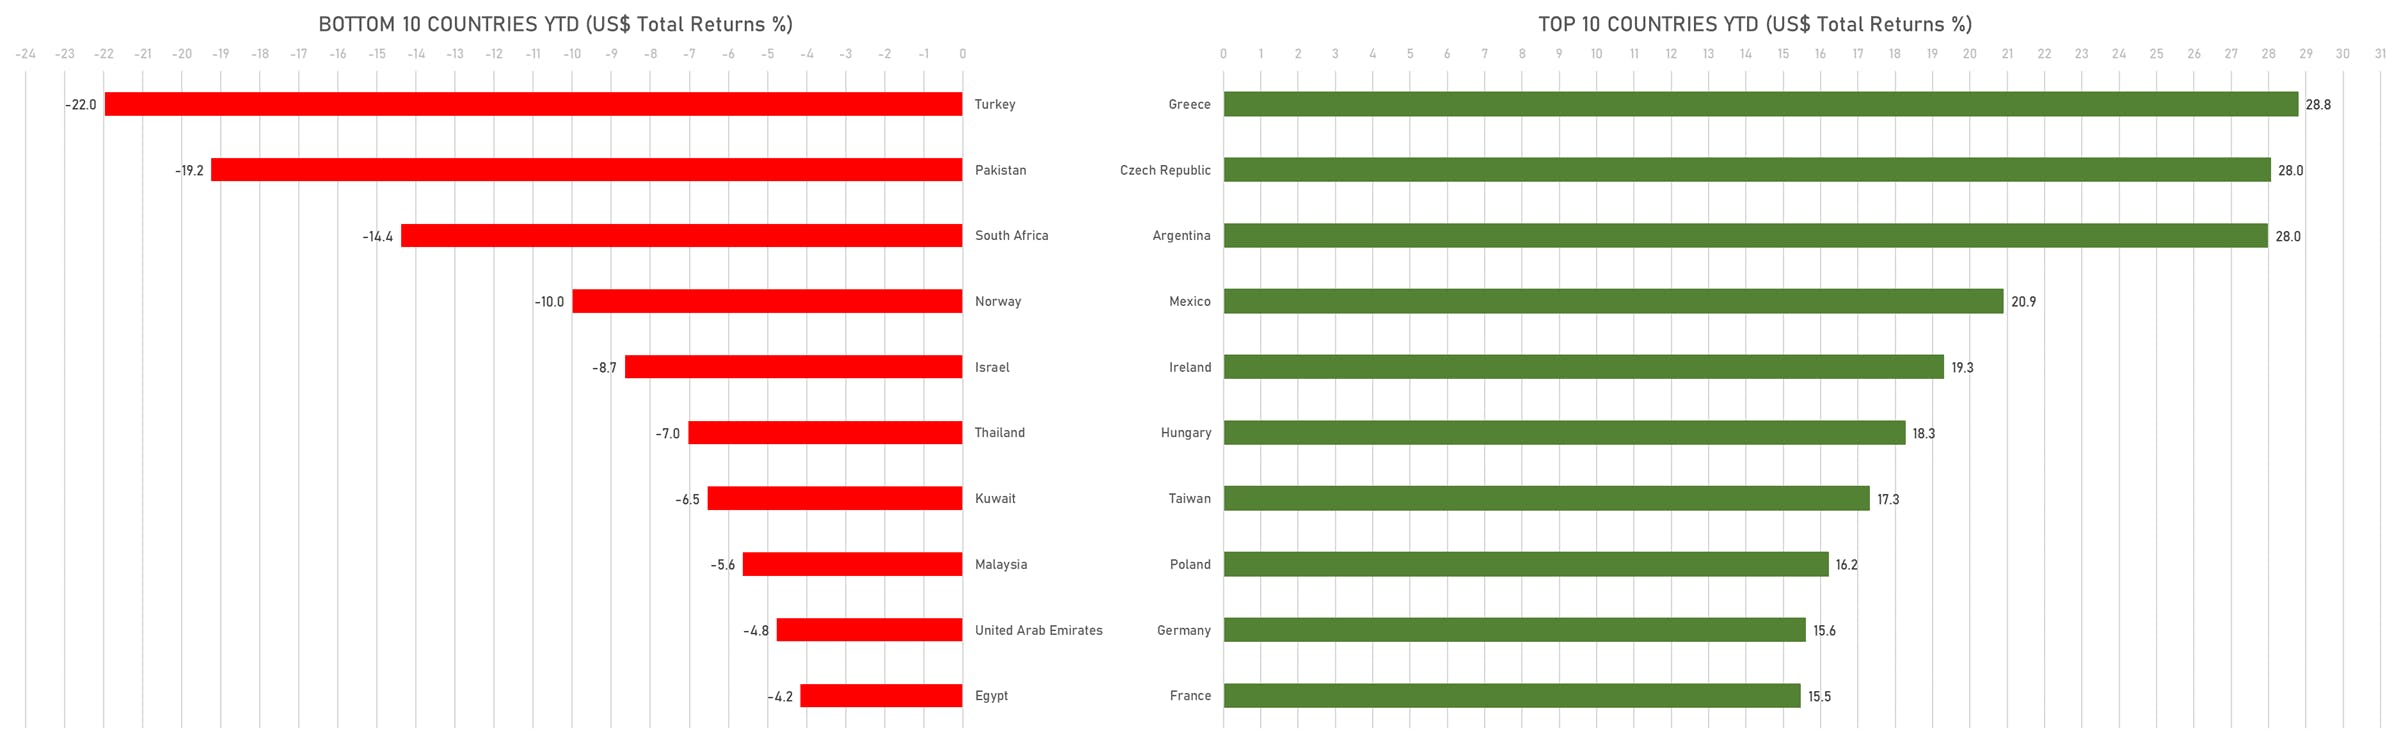
TOP / BOTTOM PERFORMING WORLD MARKETS YTD
WORLD MARKET CAPITALIZATION (US$ Trillion)