Equities
Risks Of Higher-For-Longer Fed Policy Took US Equities Lower For The Week After Solid Gains In June
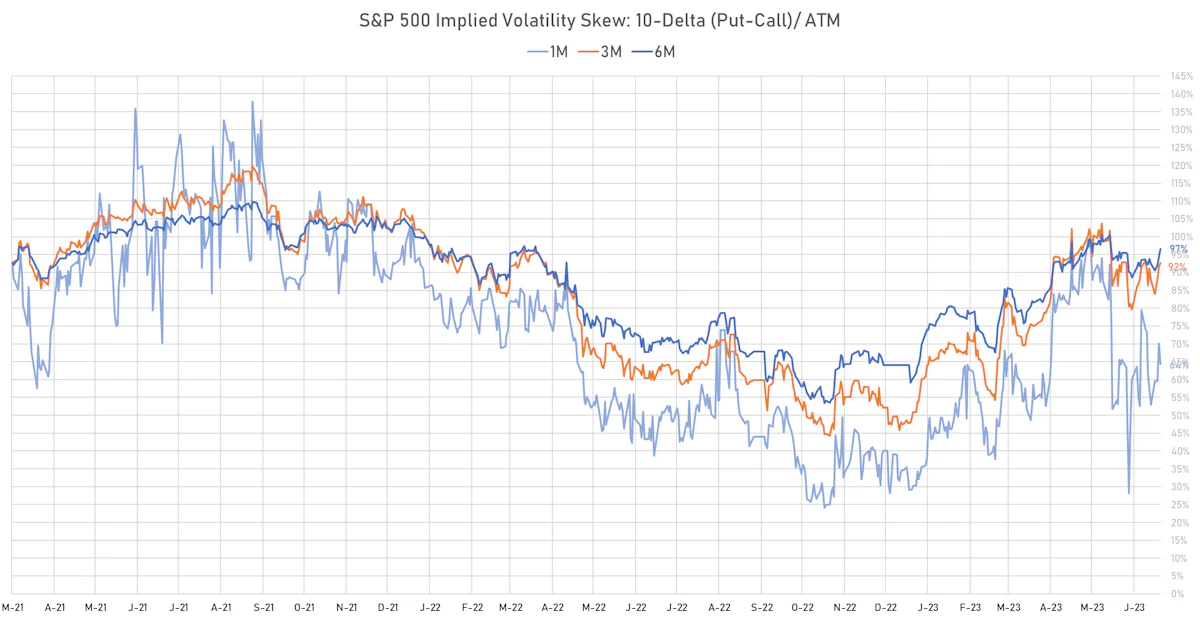
The skew in the implied volatility of S&P 500 options is close to neutral, and the aggregated positioning of hedge funds is still prudent (very low long/short ratios) heading into earnings season, possibly setting up US stocks for further gains
Published ET
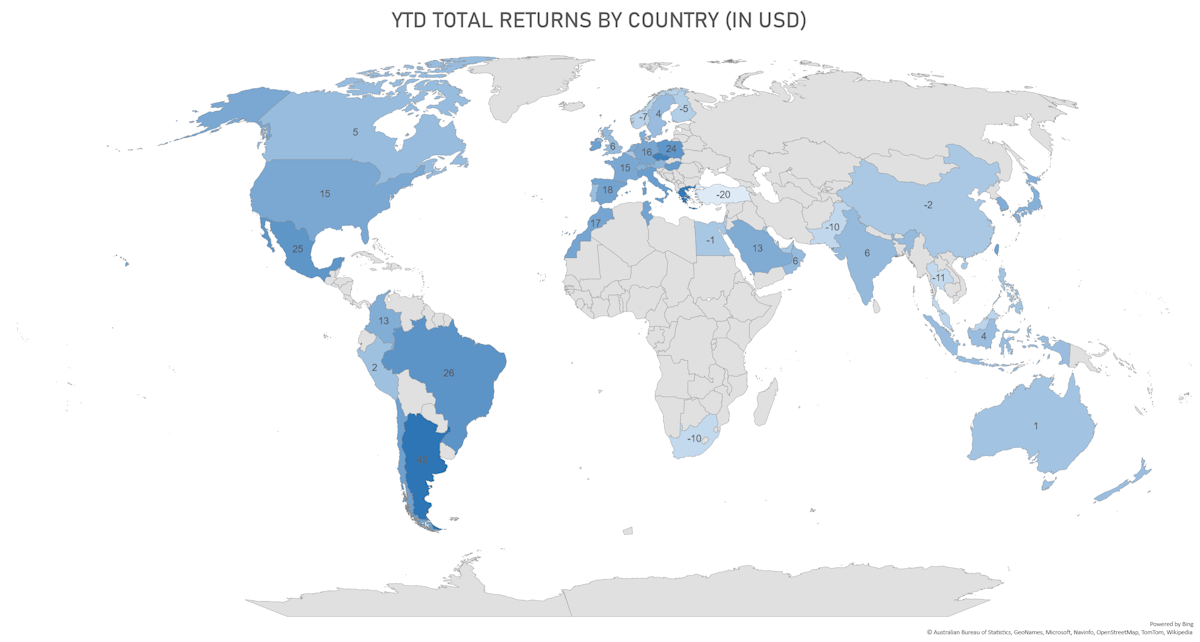
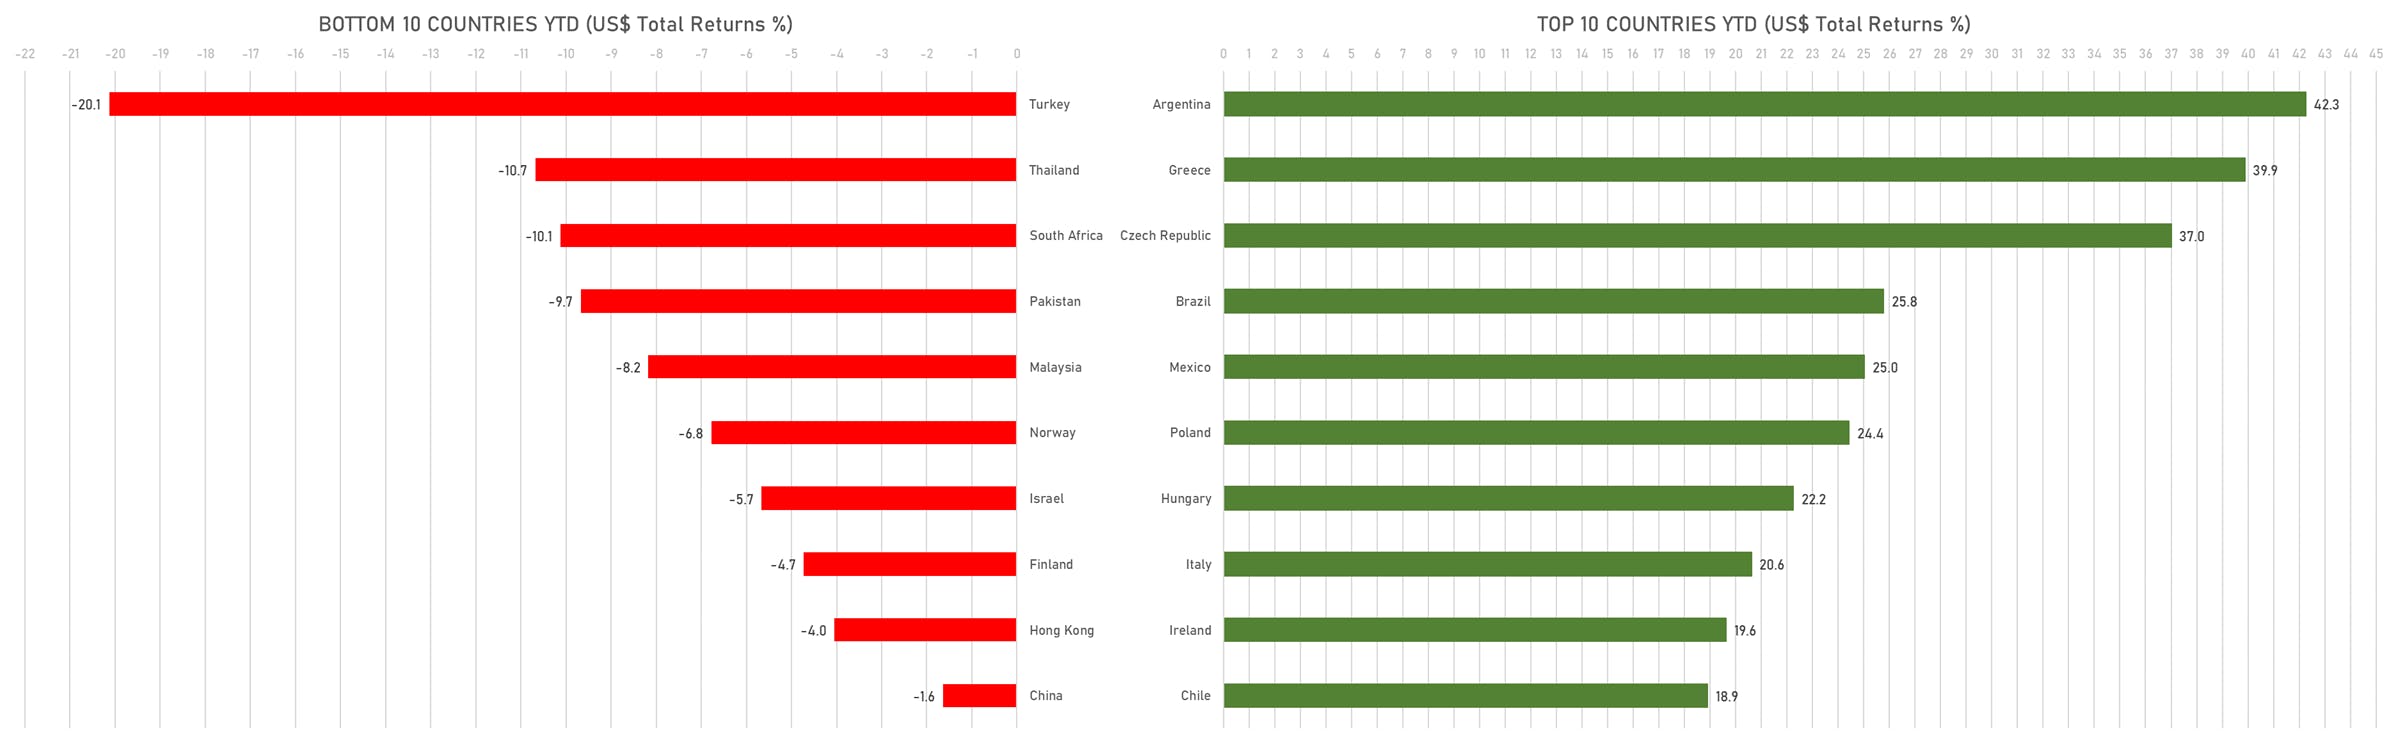
USD Total Returns YTD | Sources: phipost.com, FactSet data
DAILY SUMMARY
- Daily performance of US indices: S&P 500 down -0.29%; Nasdaq Composite down -0.13%; Wilshire 5000 down -0.04%
- 50.1% of S&P 500 stocks were up today, with 62.4% of stocks above their 200-day moving average (DMA) and 71.2% above their 50-DMA
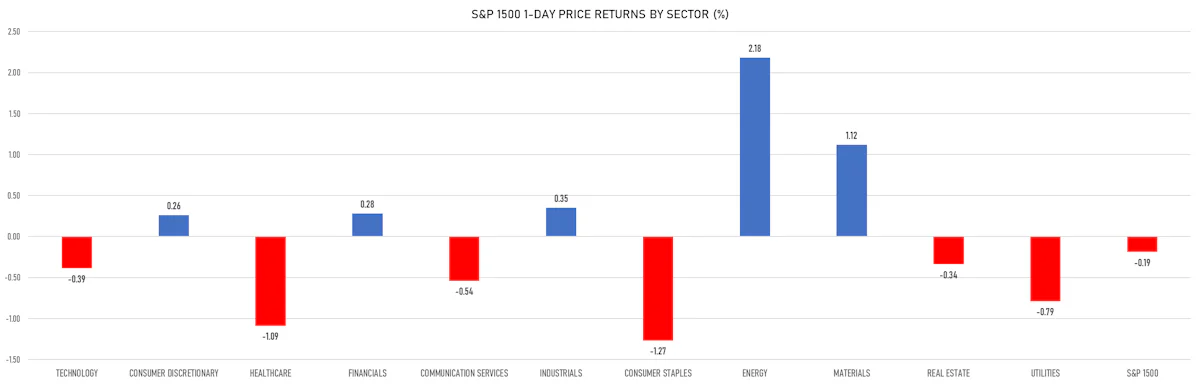
- Top performing sectors in the S&P 500: energy up 2.06% and materials up 0.88%
- Bottom performing sectors in the S&P 500: consumer staples down -1.34% and healthcare down -1.16%
- The number of shares in the S&P 500 traded today was 640m for a total turnover of US$ 67 bn
- The S&P 500 Value Index Index was down -0.1%, while the S&P 500 Growth Index Index was down -0.5%; the S&P small caps index was up 1.2% and mid caps were up 1.1%
- The volume on CME's INX (S&P 500 Index) was 2,113.4m (3-month z-score: -0.6); the 3-month average volume is 2,402.5m and the 12-month range is 903.0 - 5,761.3m
- Daily performance of international indices: Europe Stoxx 600 up 0.10%; UK FTSE 100 down -0.32%; Hang Seng SH-SZ-HK 300 Index down -0.56%; Japan's TOPIX 500 down -1.02%
VOLATILITY TODAY
- 3-month at-the-money implied volatility on the S&P 500 at 11.2%, down from 11.8%
- 3-month at-the-money implied volatility on the STOXX Europe 600 at 12.4%, down from 13.3%
TOP WINNERS TODAY
- Gorilla Technology Group Inc (GRRR), up 124.9% to $4.70 / YTD price return: -42.0% / 12-Month Price Range: $ 1.65-51.00 / Short interest (% of float): 0.6%; days to cover: 1.2
- Castle Biosciences Inc (CSTL), up 52.9% to $20.30 / YTD price return: -13.8% / 12-Month Price Range: $ 9.26-36.10 / Short interest (% of float): 3.5%; days to cover: 1.2
- Galata Acquisition Corp (GLTA), up 49.9% to $14.80 / 12-Month Price Range: $ 8.77-14.80
- TMC the metals company Inc (TMC), up 24.6% to $2.53 / YTD price return: +228.6% / 12-Month Price Range: $ 0.51-2.56 / Short interest (% of float): 3.2%; days to cover: 4.0
- Caribou Biosciences Inc (CRBU), up 22.2% to $7.26 / YTD price return: +15.6% / 12-Month Price Range: $ 3.96-13.19 / Short interest (% of float): 13.9%; days to cover: 11.3
- Carvana Co (CVNA), up 21.1% to $29.45 / YTD price return: +521.3% / 12-Month Price Range: $ 3.55-58.05
- CareDx Inc (CDNA), up 20.5% to $10.09 / YTD price return: -11.6% / 12-Month Price Range: $ 6.22-27.33
- Cibus Inc (CBUS), up 18.0% to $18.30 / YTD price return: +148.1% / 12-Month Price Range: $ 6.25-38.85 / Short interest (% of float): 0.1%; days to cover: 0.2
- ESS Tech Inc (GWH), up 17.4% to $1.75 / YTD price return: -28.0% / 12-Month Price Range: $ 0.75-5.31 (the stock is currently on the short sale restriction list)
- Kura Sushi USA Inc (KRUS), up 17.4% to $100.07 / YTD price return: +109.9% / 12-Month Price Range: $ 37.97-100.07
BIGGEST LOSERS TODAY
- GoGreen Investments Corp (LZM), down 22.3% to $12.89 / YTD price return: +24.2% / 12-Month Price Range: $ 9.64-19.92
- Abacus Life Inc (ABL), down 14.6% to $8.57 / YTD price return: -15.6% / 12-Month Price Range: $ 7.17-11.43 / Short interest (% of float): 0.0%; days to cover: 0.4 (the stock is currently on the short sale restriction list)
- Kontoor Brands Inc (KTB), down 9.5% to $37.19 / YTD price return: -7.0% / 12-Month Price Range: $ 31.46-53.83 / Short interest (% of float): 5.3%; days to cover: 6.1
- Compass Therapeutics Inc. (CMPX), down 8.8% to $2.92 / YTD price return: -41.9% / 12-Month Price Range: $ 1.81-5.65 / Short interest (% of float): 2.2%; days to cover: 7.2
- Bank of Montreal (CARD), down 8.2% to $18.19 / 12-Month Price Range: $ 18.19-24.05
- Levi Strauss & Co (LEVI), down 7.7% to $13.13 / YTD price return: -15.4% / 12-Month Price Range: $ 12.80-20.49 / Short interest (% of float): 24.9%; days to cover: 5.7
- Ambrx Biopharma Inc (AMAM), down 7.3% to $15.15 / YTD price return: +567.4% / 12-Month Price Range: $ .38-16.86 / Short interest (% of float): 1.6%; days to cover: 1.2
- CVRx Inc (CVRX), down 7.3% to $13.65 / YTD price return: -25.6% / 12-Month Price Range: $ 6.07-19.94 / Short interest (% of float): 2.0%; days to cover: 3.1
- Weave Communications Inc (WEAV), down 7.3% to $10.59 / YTD price return: +131.2% / 12-Month Price Range: $ 3.35-11.68
- Intchains Group Ltd (ICG), down 7.0% to $5.81 / 12-Month Price Range: $ 5.81-11.74 / Short interest (% of float): 0.1%; days to cover: 3.7
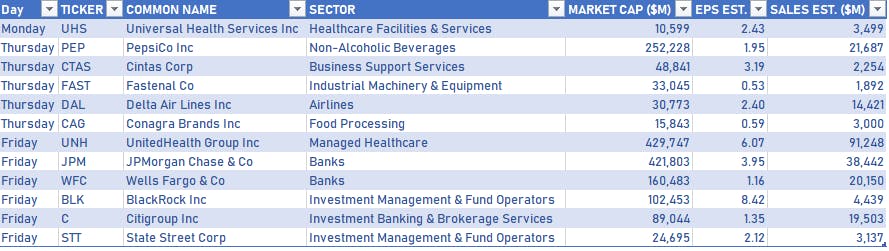
NOTABLE COMPANIES REPORTING 2Q23 EARNINGS IN THE WEEK AHEAD
TOP S&P 500 PERFORMERS IN THE PAST WEEK
- Schlumberger NV (SLB), up 8.6% to $53.35 / YTD price return: -.2% / 12-Month Price Range: $ 30.65-59.45 / Short interest (% of float): 1.3%
- Fidelity National Information Services Inc (FIS), up 8.4% to $59.27 / YTD price return: -12.6% / 12-Month Price Range: $ 48.58-105.15
- Zions Bancorporation NA (ZION), up 7.9% to $28.98 / YTD price return: -41.0% / 12-Month Price Range: $ 18.26-59.74 / Short interest (% of float): 12.8%; days to cover: 2.7
- Halliburton Co (HAL), up 7.9% to $35.58 / YTD price return: -9.6% / 12-Month Price Range: $ 23.31-43.42 / Short interest (% of float): 2.6%
- Global Payments Inc (GPN), up 7.4% to $105.85 / YTD price return: +6.6% / 12-Month Price Range: $ 92.27-136.84
- Bunge Ltd (BG), up 7.0% to $100.99 / YTD price return: +1.2% / 12-Month Price Range: $ 80.47-106.99 / Short interest (% of float): 2.9%; days to cover: 3.4
- Albemarle Corp (ALB), up 6.5% to $237.52 / YTD price return: +9.5% / 12-Month Price Range: $ 171.93-334.25 / Short interest (% of float): 5.6%; days to cover: 3.1
- Aptiv PLC (APTV), up 5.3% to $107.55 / YTD price return: +15.5% / 12-Month Price Range: $ 77.97-124.86 / Short interest (% of float): 2.2%; days to cover: 2.5
- Truist Financial Corp (TFC), up 5.0% to $31.88 / YTD price return: -25.9% / 12-Month Price Range: $ 25.56-52.21 / Short interest (% of float): 2.7%; days to cover: 2.6
- Mosaic Co (MOS), up 5.0% to $36.75 / YTD price return: -15.8% / 12-Month Price Range: $ 31.49-62.81 / Short interest (% of float): 2.3%
BOTTOM S&P 500 PERFORMERS IN THE PAST WEEK
- Generac Holdings Inc (GNRC), down 8.8% to $136.08 / YTD price return: +35.2% / 12-Month Price Range: $ 86.33-282.34 / Short interest (% of float): 7.4%; days to cover: 5.1
- Align Technology Inc (ALGN), down 6.8% to $329.54 / YTD price return: +56.3% / 12-Month Price Range: $ 172.29-368.63 / Short interest (% of float): 3.5%; days to cover: 3.8
- KLA Corp (KLAC), down 6.0% to $455.83 / YTD price return: +20.9% / 12-Month Price Range: $ 250.74-488.26 / Short interest (% of float): 1.7%
- Merck & Co Inc (MRK), down 5.5% to $109.00 / YTD price return: -1.8% / 12-Month Price Range: $ 84.52-119.64
- Nike Inc (NKE), down 5.4% to $104.46 / YTD price return: -10.7% / 12-Month Price Range: $ 82.23-131.25 / Short interest (% of float): 1.6%; days to cover: 2.2
- DR Horton Inc (DHI), down 5.2% to $115.39 / YTD price return: +29.4% / 12-Month Price Range: $ 66.03-124.05 / Short interest (% of float): 3.2%; days to cover: 3.8
- Marketaxess Holdings Inc (MKTX), down 5.1% to $248.10 / YTD price return: -11.0% / 12-Month Price Range: $ 217.97-398.91 / Short interest (% of float): 4.1%; days to cover: 4.6
- Analog Devices Inc (ADI), down 4.9% to $185.31 / YTD price return: +12.9% / 12-Month Price Range: $ 133.48-198.14 / Short interest (% of float): 1.5%; days to cover: 1.9
- Monolithic Power Systems Inc (MPWR), down 4.9% to $513.90 / YTD price return: +45.3% / 12-Month Price Range: $ 303.30-553.64 / Short interest (% of float): 5.0%; days to cover: 2.9
- Intel Corp (INTC), down 4.8% to $31.85 / YTD price return: +20.5% / 12-Month Price Range: $ 24.59-40.73 / Short interest (% of float): 1.6%; days to cover: 1.4
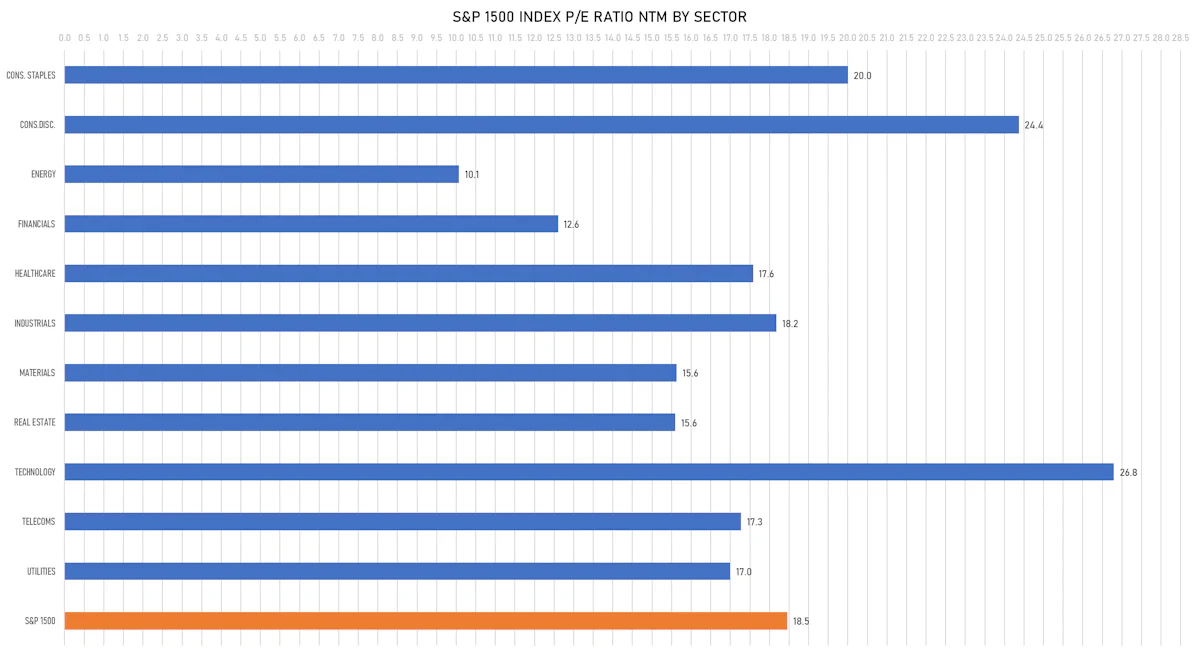
VALUATION MULTIPLES BY SECTORS
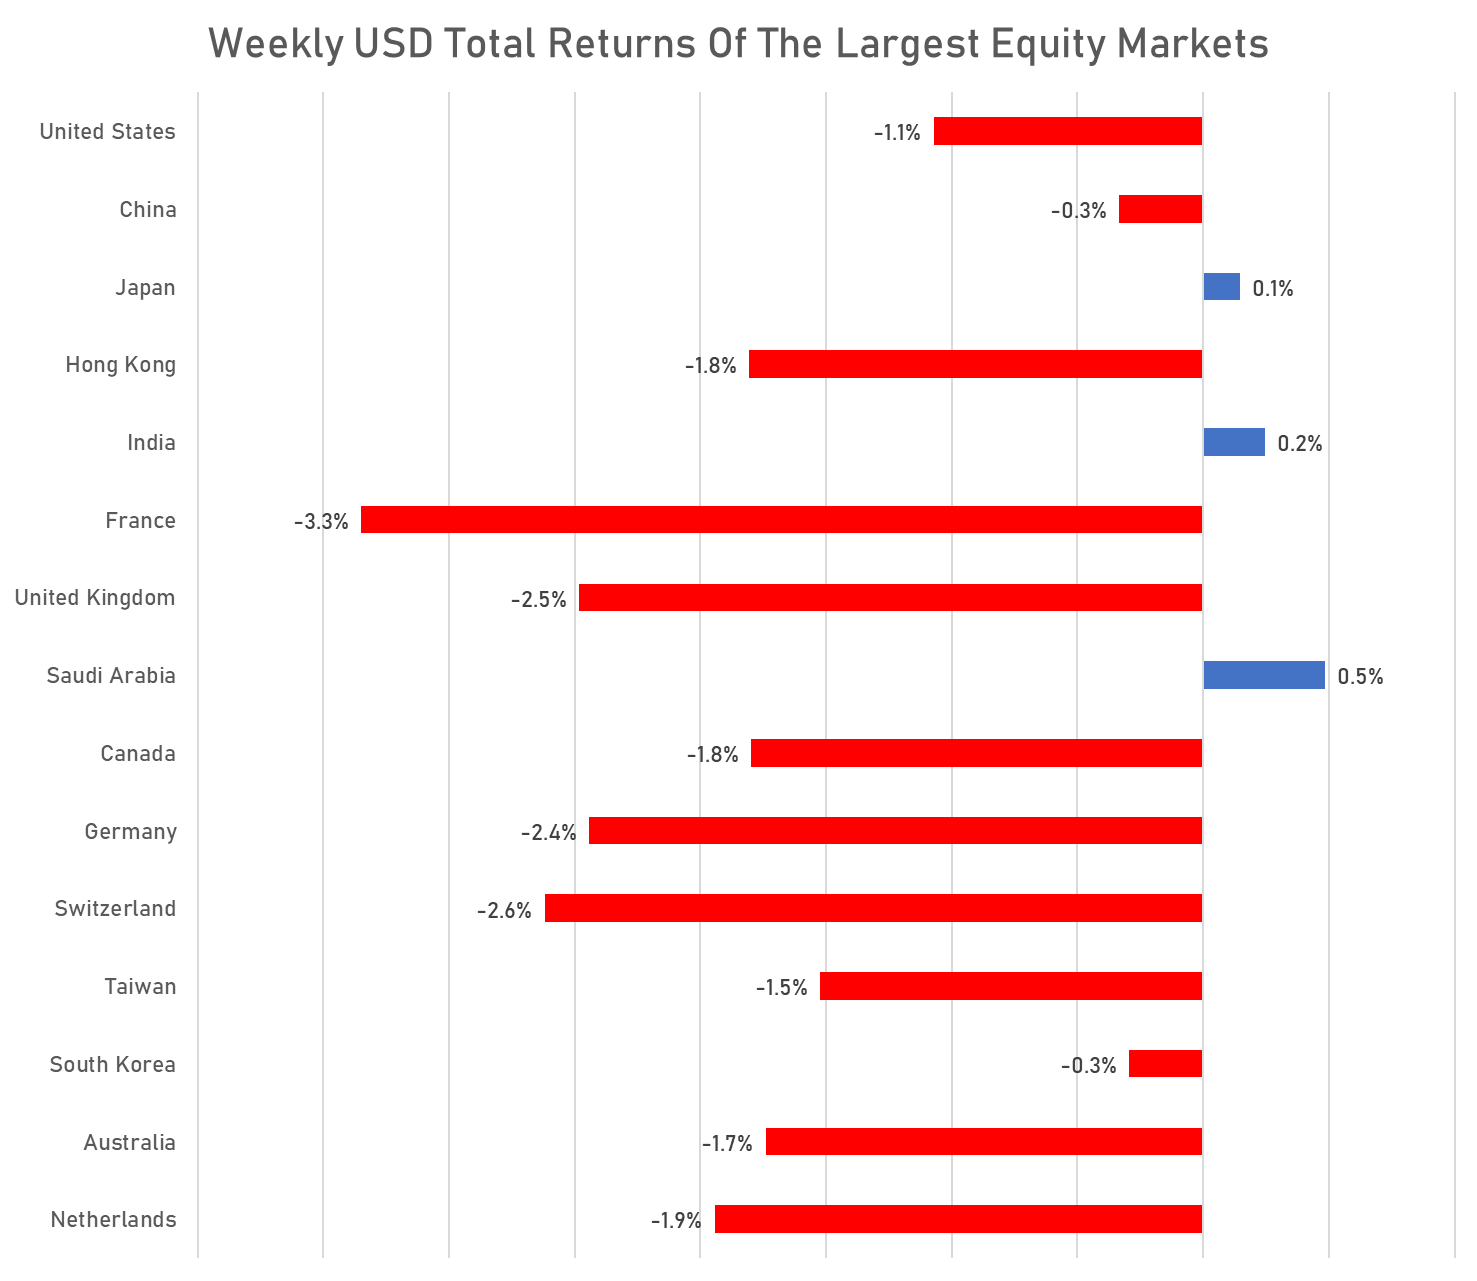
WEEKLY TOTAL RETURNS OF MAJOR GLOBAL EQUITY MARKETS (US$ TR)
TOP / BOTTOM PERFORMING WORLD MARKETS YTD (US$ TR)
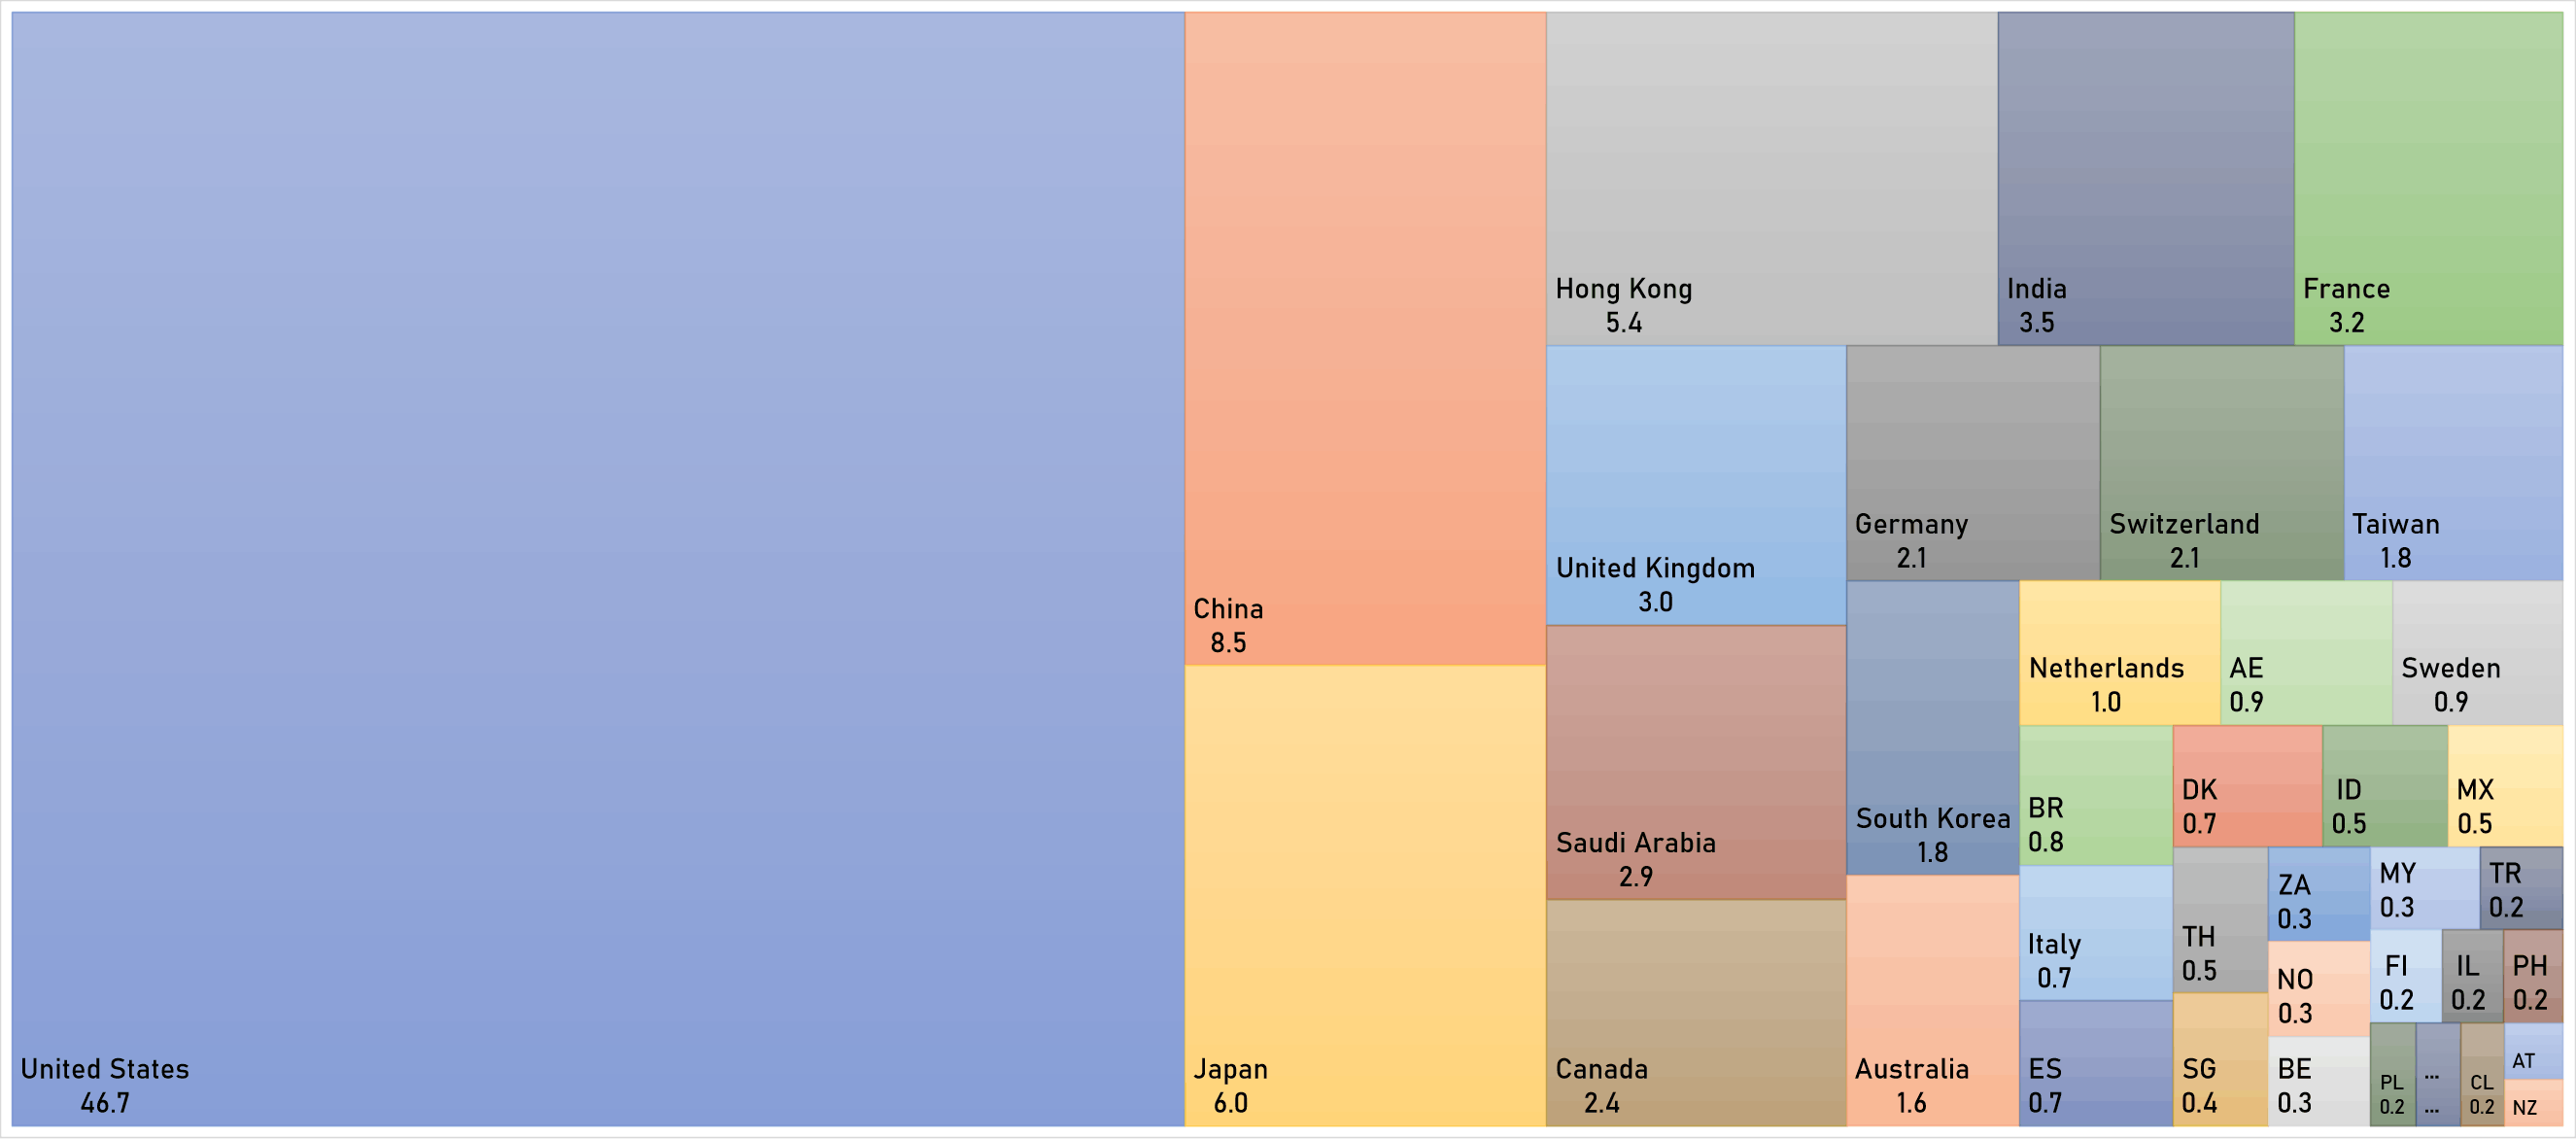
WORLD MARKET CAPITALIZATION (US$ Trillion)