Equities
Strong Performance Across US Equities As 2Q23 Earnings Season Gets Under Way
The improvement in market breadth could prove to be a headfake: if anything pulls equities higher from here, it will probably be more of the magnificent seven, rather than to a true broadening of the rally
Published ET
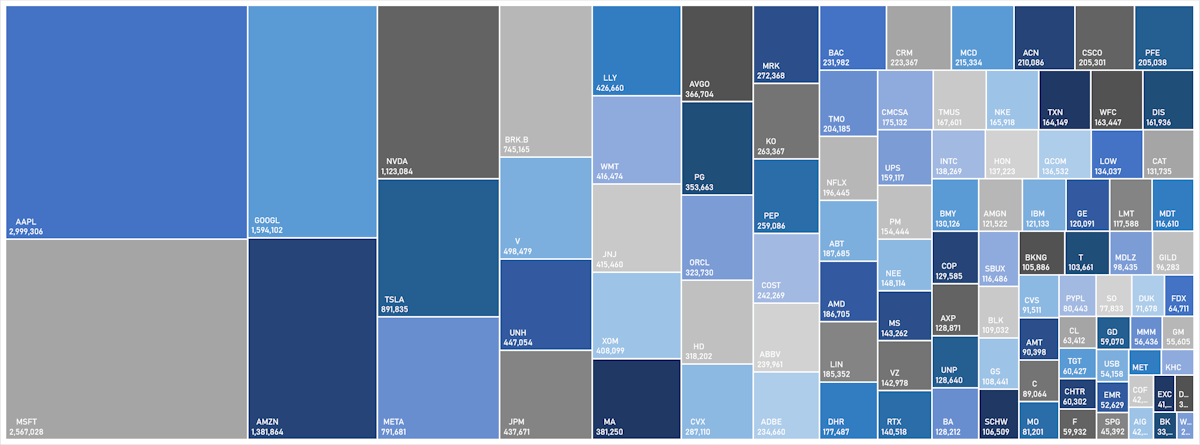
S&P 100 Market Caps | Sources: phipost.com, Refinitiv data
DAILY SUMMARY
- Daily performance of US indices: S&P 500 down -0.10%; Nasdaq Composite down -0.18%; Wilshire 5000 up 0.03%
- 34.2% of S&P 500 stocks were up today, with 67.6% of stocks above their 200-day moving average (DMA) and 82.3% above their 50-DMA
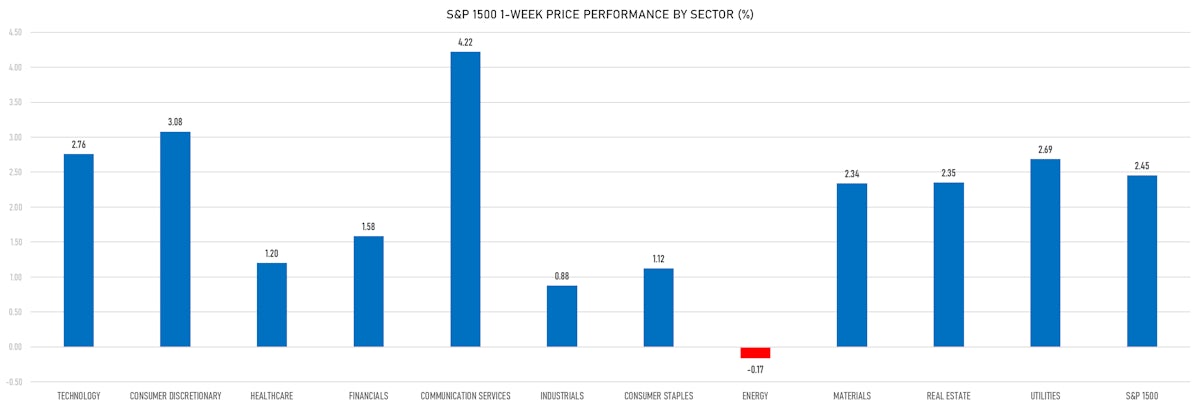
- Top performing sectors in the S&P 500: healthcare up 1.50% and consumer staples up 0.35%
- Bottom performing sectors in the S&P 500: energy down -2.75% and financials down -0.68%
- The number of shares in the S&P 500 traded today was 598m for a total turnover of US$ 67 bn
- The S&P 500 Value Index Index was down -0.5%, while the S&P 500 Growth Index Index was up 0.2%; the S&P small caps index was down -1.0% and mid caps were down -1.2%
- The volume on CME's INX (S&P 500 Index) was 2,371.3m (3-month z-score: -0.1); the 3-month average volume is 2,413.0m and the 12-month range is 903.0 - 5,761.3m
- Daily performance of international indices: Europe Stoxx 600 down -0.11%; UK FTSE 100 down -0.08%; Hang Seng SH-SZ-HK 300 Index down -0.05%; Japan's TOPIX 500 down -0.17%
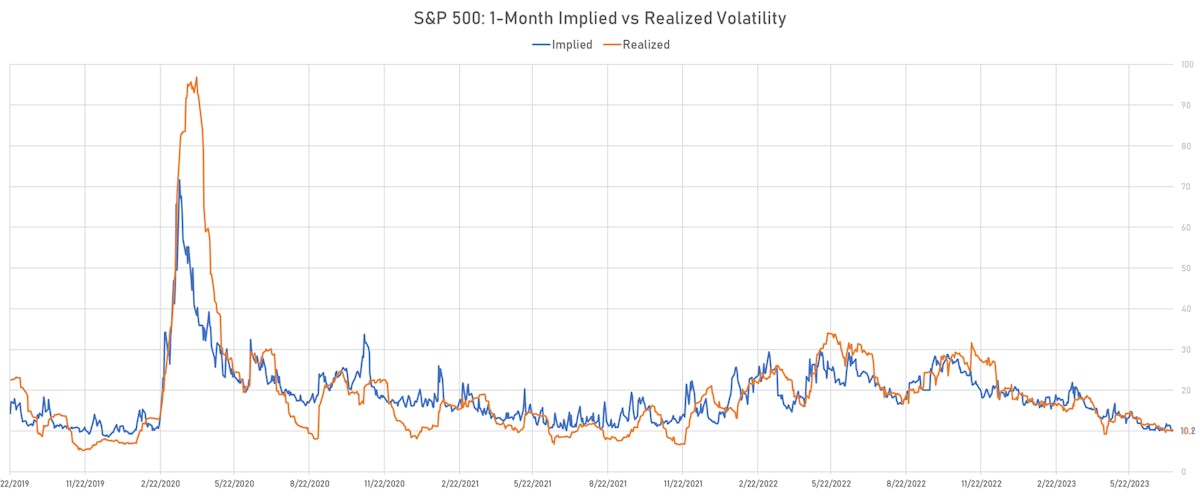
VOLATILITY TODAY
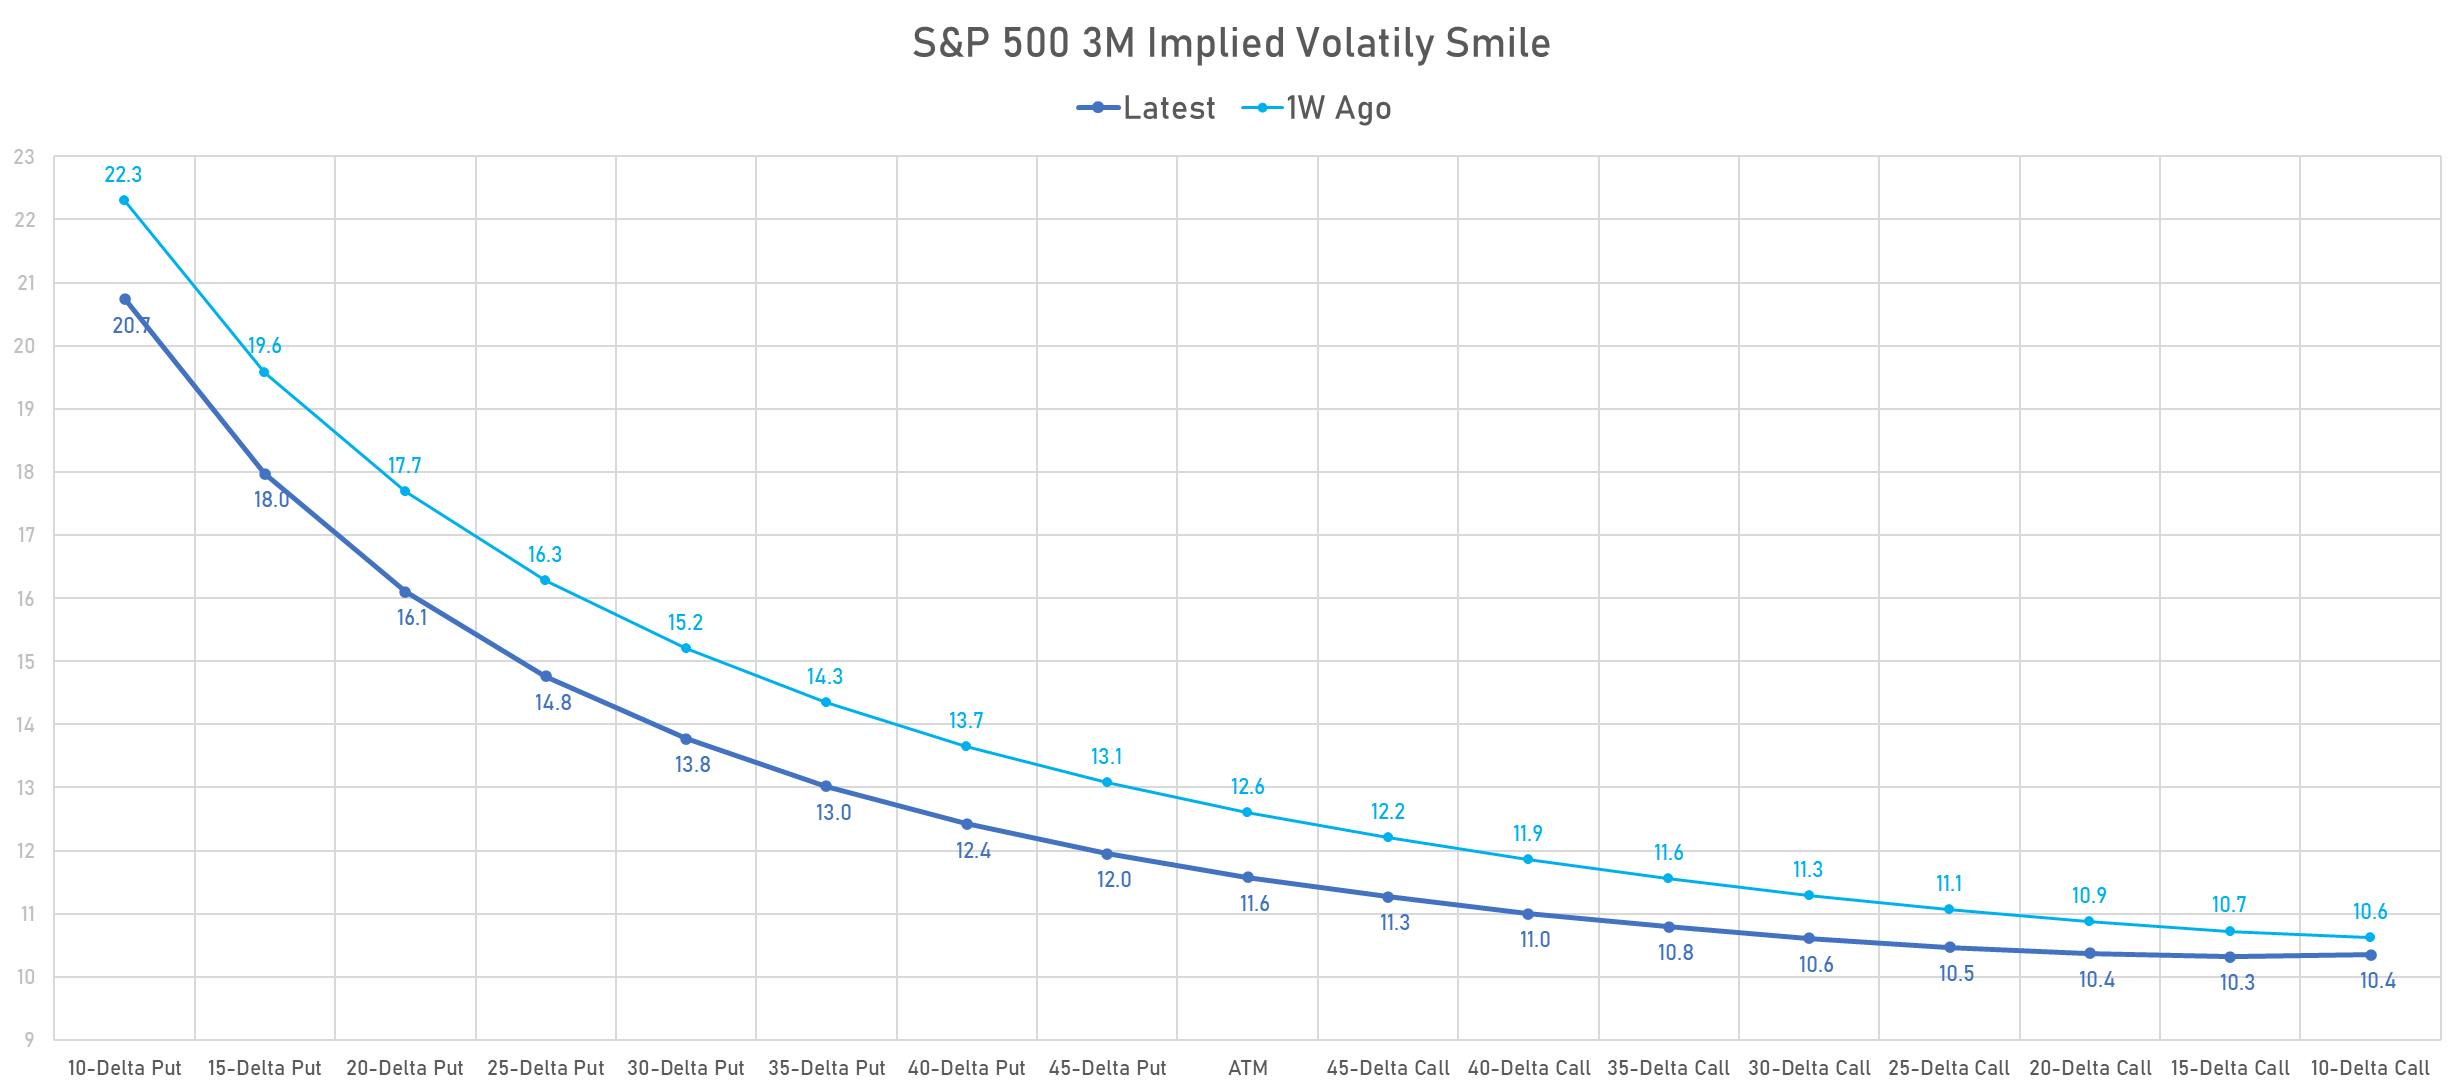
- 3-month at-the-money implied volatility on the S&P 500 at 10.2%, up from 10.0%
- 3-month at-the-money implied volatility on the STOXX Europe 600 at 10.1%, down from 10.5%
TOP WINNERS TODAY
- Canoo Inc (GOEV), up 27.3% to $0.71 / YTD price return: -42.5% / 12-Month Price Range: $ 0.41-5.00 / Short interest (% of float): 9.4%; days to cover: 2.0
- Apogee Therapeutics Inc (APGE), up 24.9% to $21.23
- ACADIA Pharmaceuticals Inc (ACAD), up 24.7% to $32.18 / YTD price return: +102.1% / 12-Month Price Range: $ 13.73-32.18 / Short interest (% of float): 5.2%; days to cover: 6.2
- TMC the metals company Inc (TMC), up 18.7% to $2.16 / YTD price return: +180.5% / 12-Month Price Range: $ 0.51-3.20 / Short interest (% of float): 3.2%; days to cover: 2.2
- Arcturus Therapeutics Holdings Inc (ARCT), up 15.0% to $35.44 / YTD price return: +109.0% / 12-Month Price Range: $ 13.02-35.44 / Short interest (% of float): 14.5%; days to cover: 8.8
- Hyzon Motors Inc (HYZN), up 13.8% to $1.48 / YTD price return: -4.5% / 12-Month Price Range: $ 0.45-4.53 / Short interest (% of float): 18.3%; days to cover: 8.0
- SHENGFENG DEVELOPMENT Ltd (SFWL), up 13.2% to $6.52 / 12-Month Price Range: $ 2.94-12.45 / Short interest (% of float): 3.0%; days to cover: 0.8
- Alvotech SA (ALVO), up 12.1% to $9.66 / YTD price return: -3.4% / 12-Month Price Range: $ 5.20-14.60 / Short interest (% of float): 0.1%; days to cover: 1.3
- Elanco Animal Health Inc (ELAN), up 11.7% to $11.84 / YTD price return: -3.1% / 12-Month Price Range: $ 7.88-20.97 / Short interest (% of float): 1.5%; days to cover: 1.0
- Glaukos Corp (GKOS), up 10.4% to $79.09 / 12-Month Price Range: $ 40.45-79.09 / Short interest (% of float): 12.8%; days to cover: 10.6
BIGGEST LOSERS TODAY
- Telus International Cda Inc (TIXT), down 31.3% to $10.10 / YTD price return: -49.0% / 12-Month Price Range: $ 10.10-31.52 / Short interest (% of float): 0.8%; days to cover: 2.8 (the stock is currently on the short sale restriction list)
- Leslie's Inc (LESL), down 29.6% to $6.70 / YTD price return: -45.1% / 12-Month Price Range: $ 6.70-17.13 / Short interest (% of float): 14.7%; days to cover: 6.6 (the stock is currently on the short sale restriction list)
- Opera Ltd (OPRA), down 29.0% to $19.76 / YTD price return: +252.5% / 12-Month Price Range: $ 3.49-28.58 / Short interest (% of float): 1.5%; days to cover: 1.1 (the stock is currently on the short sale restriction list)
- Caribou Biosciences Inc (CRBU), down 22.6% to $6.30 / YTD price return: +.3% / 12-Month Price Range: $ 3.96-13.19 / Short interest (% of float): 11.4%; days to cover: 6.2 (the stock is currently on the short sale restriction list)
- Lilium NV (LILM), down 22.4% to $1.32 / YTD price return: +15.8% / 12-Month Price Range: $ .37-3.25 / Short interest (% of float): 5.4%; days to cover: 1.8 (the stock is currently on the short sale restriction list)
- Funko Inc (FNKO), down 19.1% to $8.15 / YTD price return: -25.3% / 12-Month Price Range: $ 7.14-27.79 / Short interest (% of float): 8.7%; days to cover: 6.1 (the stock is currently on the short sale restriction list)
- CommScope Holding Company Inc (COMM), down 16.9% to $5.43 / YTD price return: -26.2% / 12-Month Price Range: $ 3.97-13.73 / Short interest (% of float): 7.2%; days to cover: 4.5 (the stock is currently on the short sale restriction list)
- Vroom Inc (VRM), down 16.8% to $1.83 / YTD price return: +79.4% / 12-Month Price Range: $ .73-2.76 / Short interest (% of float): 14.1%; days to cover: 4.5 (the stock is currently on the short sale restriction list)
- D-Wave Quantum Inc (QBTS), down 16.3% to $2.20 / 12-Month Price Range: $ .40-13.23 / Short interest (% of float): 2.2%; days to cover: 0.2 (the stock is currently on the short sale restriction list)
- Applied Optoelectronics Inc (AAOI), down 14.3% to $9.14 / YTD price return: +383.6% / 12-Month Price Range: $ 1.53-11.48 / Short interest (% of float): 19.2%; days to cover: 2.8 (the stock is currently on the short sale restriction list)
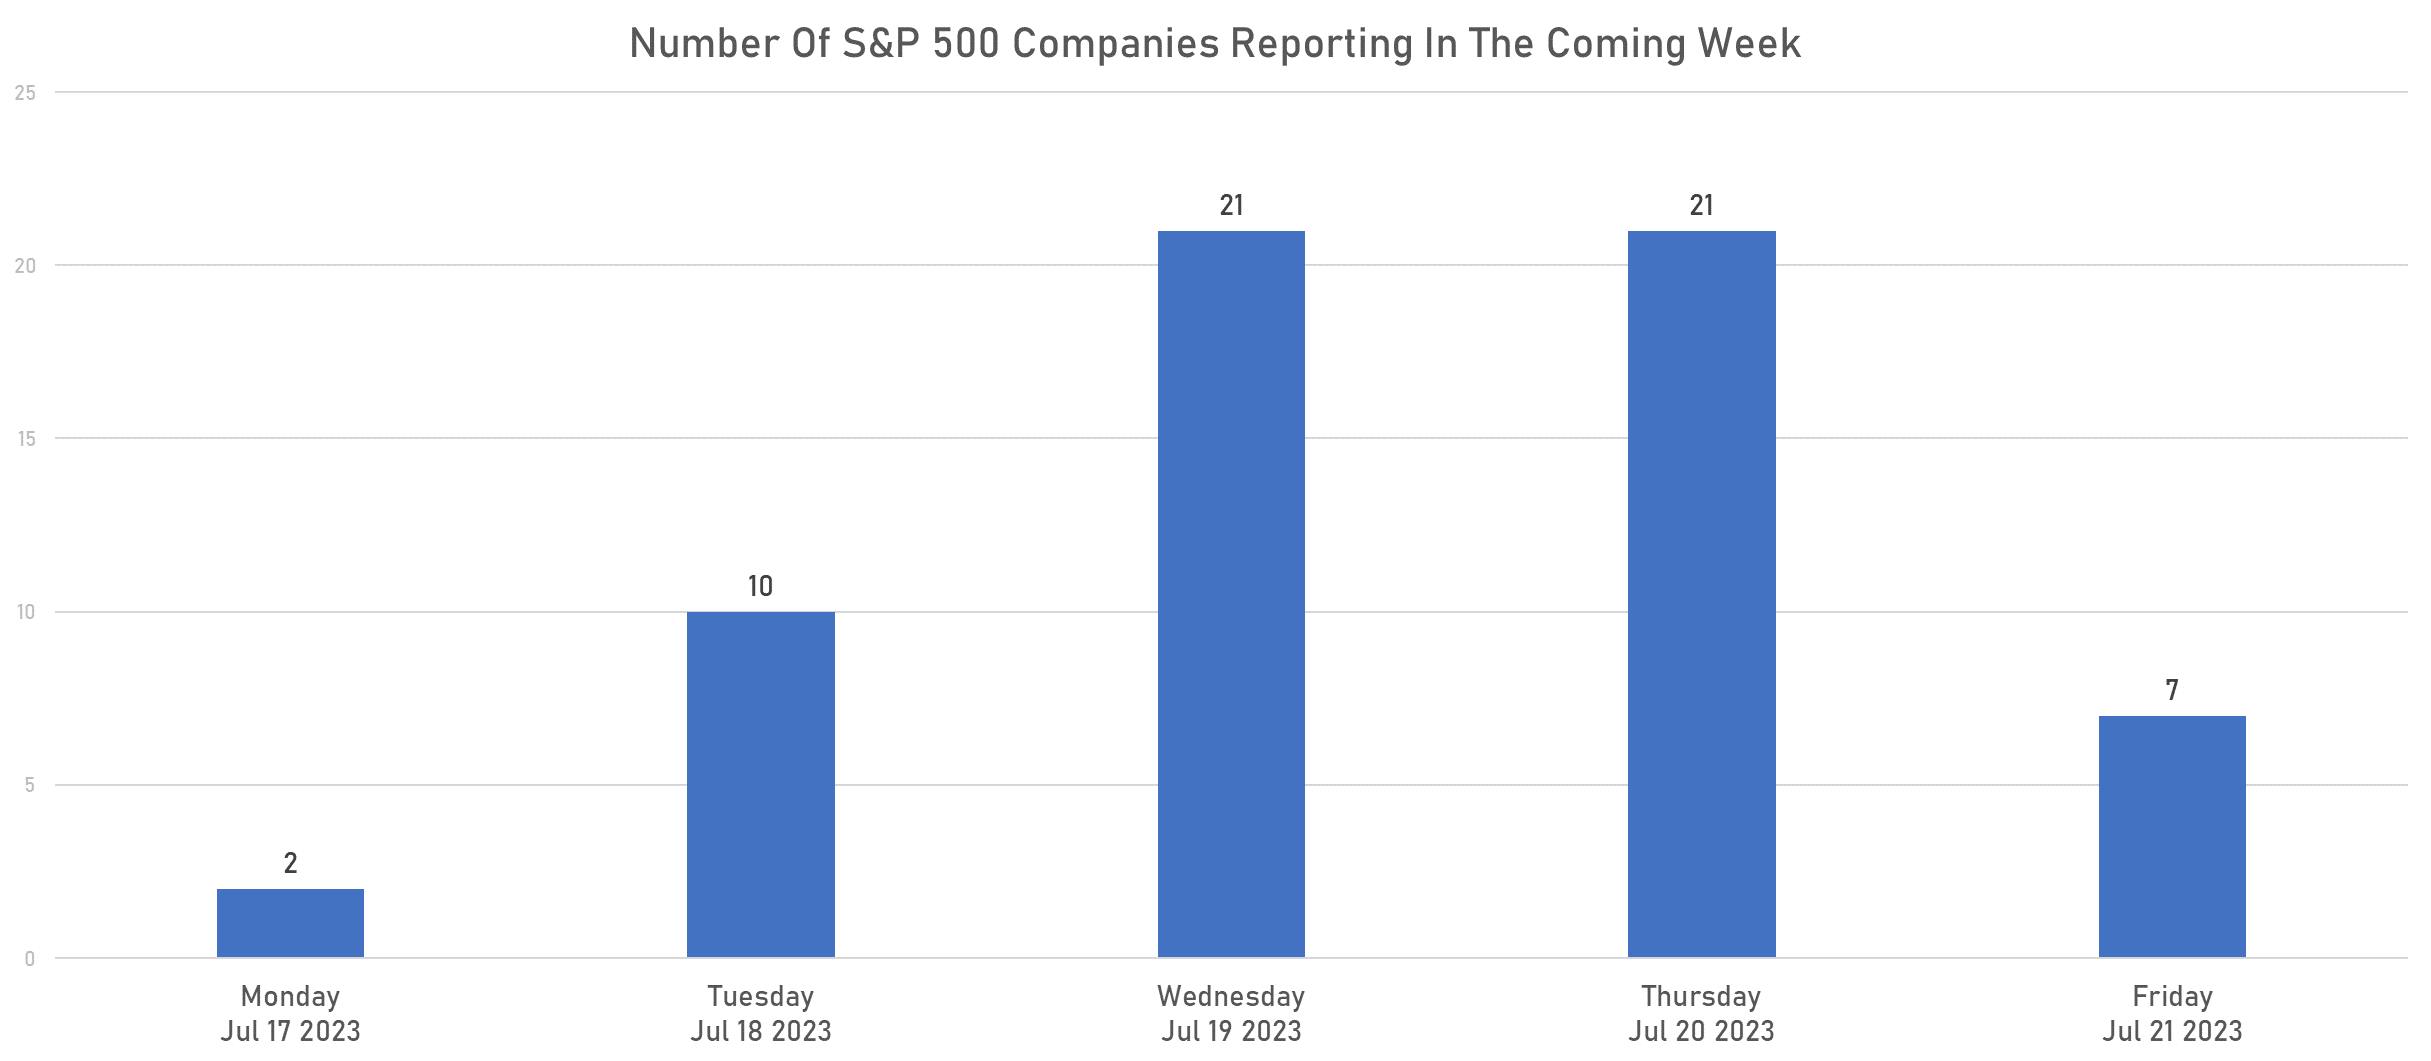
NUMBER OF S&P 500 COMPANIES REPORTING NEXT WEEK
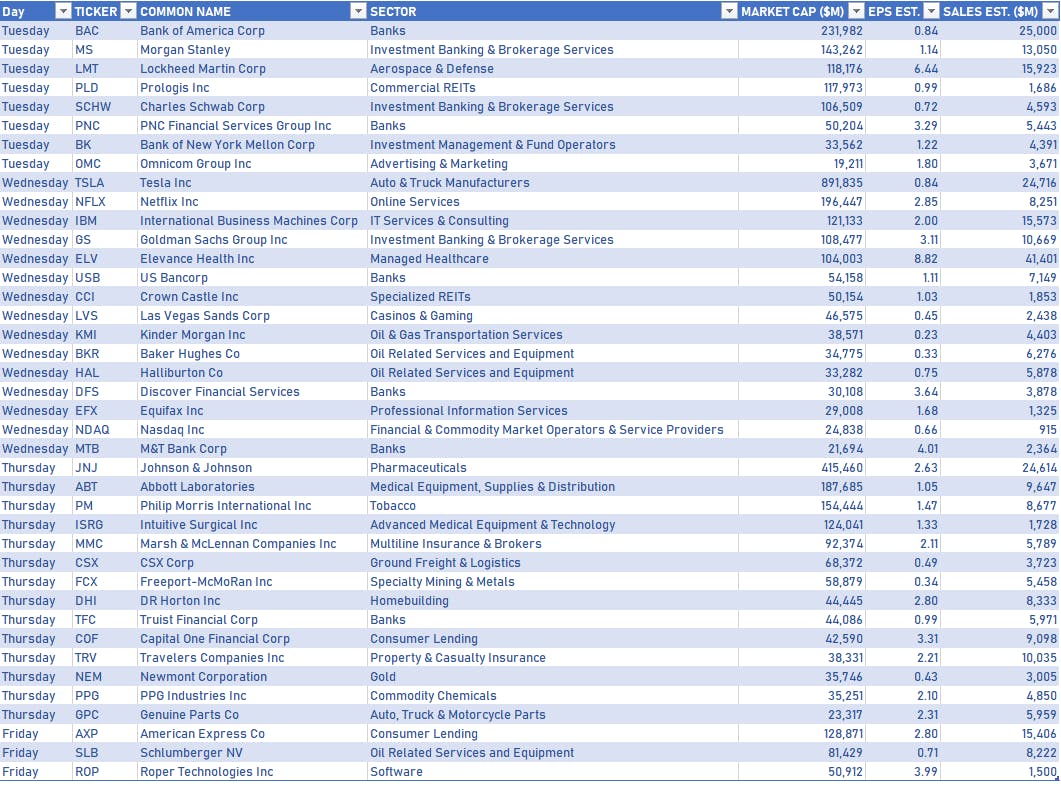
NOTABLE US EARNINGS RELEASES IN THE WEEK AHEAD
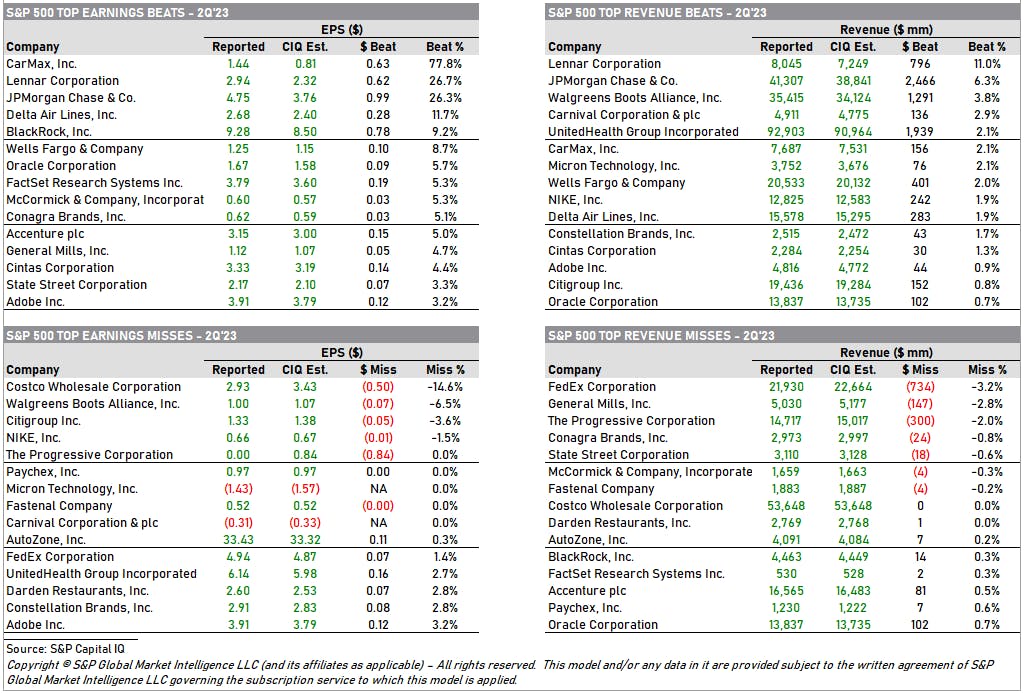
2Q23 EARNINGS: TOP BEATS & MISSES
TOP S&P 500 PERFORMERS THIS WEEK
- Match Group Inc (MTCH), up 13.9% to $48.07 / YTD price return: +15.9% / 12-Month Price Range: $ 30.73-77.77 / Short interest (% of float): 4.0%; days to cover: 2.0
- DR Horton Inc (DHI), up 12.9% to $130.31 / YTD price return: +46.2% / 12-Month Price Range: $ 66.03-130.31 / Short interest (% of float): 2.8%; days to cover: 2.8
- Domino's Pizza Inc (DPZ), up 12.6% to $384.66 / YTD price return: +11.0% / 12-Month Price Range: $ 285.90-425.59 / Short interest (% of float): 4.1%; days to cover: 2.2
- MGM Resorts International (MGM), up 12.0% to $48.26 / YTD price return: +43.9% / 12-Month Price Range: $ 28.06-49.64 / Short interest (% of float): 3.4%; days to cover: 2.4
- ETSY Inc (ETSY), up 11.5% to $92.25 / YTD price return: -23.0% / 12-Month Price Range: $ 78.26-149.84 / Short interest (% of float): 9.6%; days to cover: 3.5
- Align Technology Inc (ALGN), up 11.3% to $366.88 / YTD price return: +74.0% / 12-Month Price Range: $ 172.29-368.63 / Short interest (% of float): 3.8%; days to cover: 4.0
- Lennar Corp (LEN), up 10.8% to $133.24 / YTD price return: +47.2% / 12-Month Price Range: $ 69.90-133.24 / Short interest (% of float): 2.3%; days to cover: 2.0
- Newell Brands Inc (NWL), up 10.4% to $9.79 / YTD price return: -25.2% / 12-Month Price Range: $ 7.81-21.54 / Short interest (% of float): 6.6%; days to cover: 3.5
- Pultegroup Inc (PHM), up 10.0% to $82.51 / YTD price return: +81.2% / 12-Month Price Range: $ 35.99-82.51 / Short interest (% of float): 3.9%; days to cover: 3.1
- Monolithic Power Systems Inc (MPWR), up 9.9% to $565.01 / YTD price return: +59.8% / 12-Month Price Range: $ 303.30-581.15 / Short interest (% of float): 4.5%; days to cover: 2.9
BOTTOM S&P 500 PERFORMERS THIS WEEK
- Progressive Corp (PGR), down 11.0% to $116.79 / YTD price return: -10.0% / 12-Month Price Range: $ 109.44-149.86 / Short interest (% of float): 0.5%; days to cover: 1.2 (the stock is currently on the short sale restriction list)
- Carnival Corp (CCL), down 9.5% to $17.23 / YTD price return: +113.8% / 12-Month Price Range: $ 6.12-19.55 / Short interest (% of float): 11.2%; days to cover: 2.3
- FMC Corp (FMC), down 8.7% to $95.23 / YTD price return: -23.7% / 12-Month Price Range: $ 88.79-134.38 / Short interest (% of float): 1.3%; days to cover: 1.5
- State Street Corp (STT), down 7.8% to $68.10 / YTD price return: -12.2% / 12-Month Price Range: $ 58.66-94.71 / Short interest (% of float): 1.5%; days to cover: 2.0 (the stock is currently on the short sale restriction list)
- AT&T Inc (T), down 7.1% to $14.50 / YTD price return: -21.2% / 12-Month Price Range: $ 14.47-20.86 / Short interest (% of float): 1.3%; days to cover: 2.1
- Norwegian Cruise Line Holdings Ltd (NCLH), down 6.7% to $20.42 / YTD price return: +66.8% / 12-Month Price Range: $ 10.84-22.68 / Short interest (% of float): 9.6%; days to cover: 2.6
- Bath & Body Works Inc (BBWI), down 6.6% to $35.19 / YTD price return: -16.5% / 12-Month Price Range: $ 25.81-49.54 / Short interest (% of float): 4.4%; days to cover: 2.4
- Allstate Corp (ALL), down 6.5% to $101.18 / YTD price return: -25.4% / 12-Month Price Range: $ 101.18-142.13 / Short interest (% of float): 1.7%; days to cover: 2.2
- Juniper Networks Inc (JNPR), down 6.0% to $29.22 / YTD price return: -8.6% / 12-Month Price Range: $ 25.18-34.53 / Short interest (% of float): 2.6%; days to cover: 2.0
- Corteva Inc (CTVA), down 5.3% to $54.25 / YTD price return: -7.7% / 12-Month Price Range: $ 50.03-68.43 / Short interest (% of float): 0.8%; days to cover: 1.6
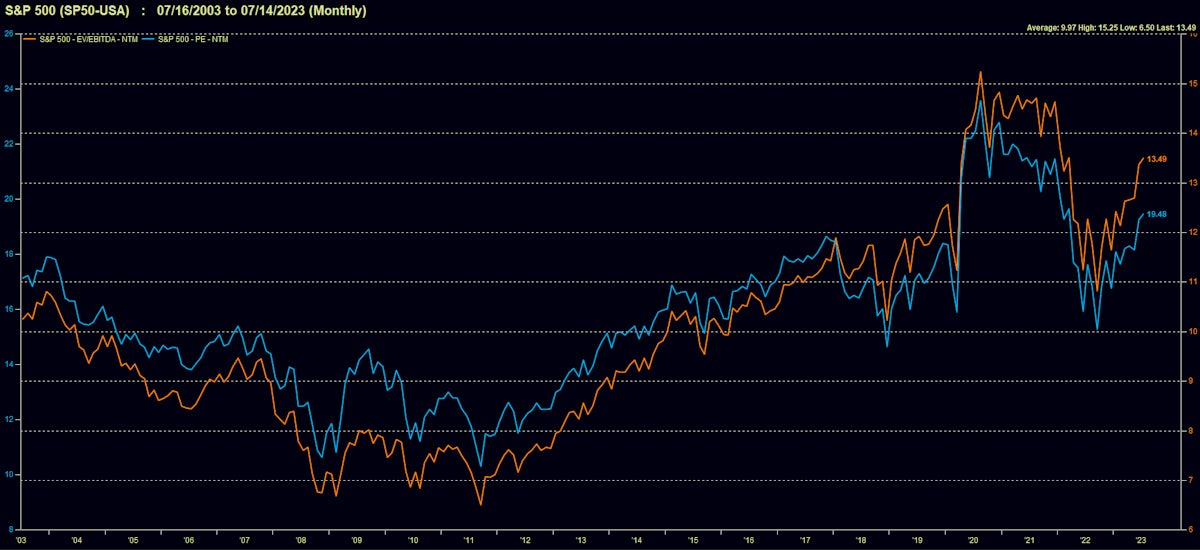
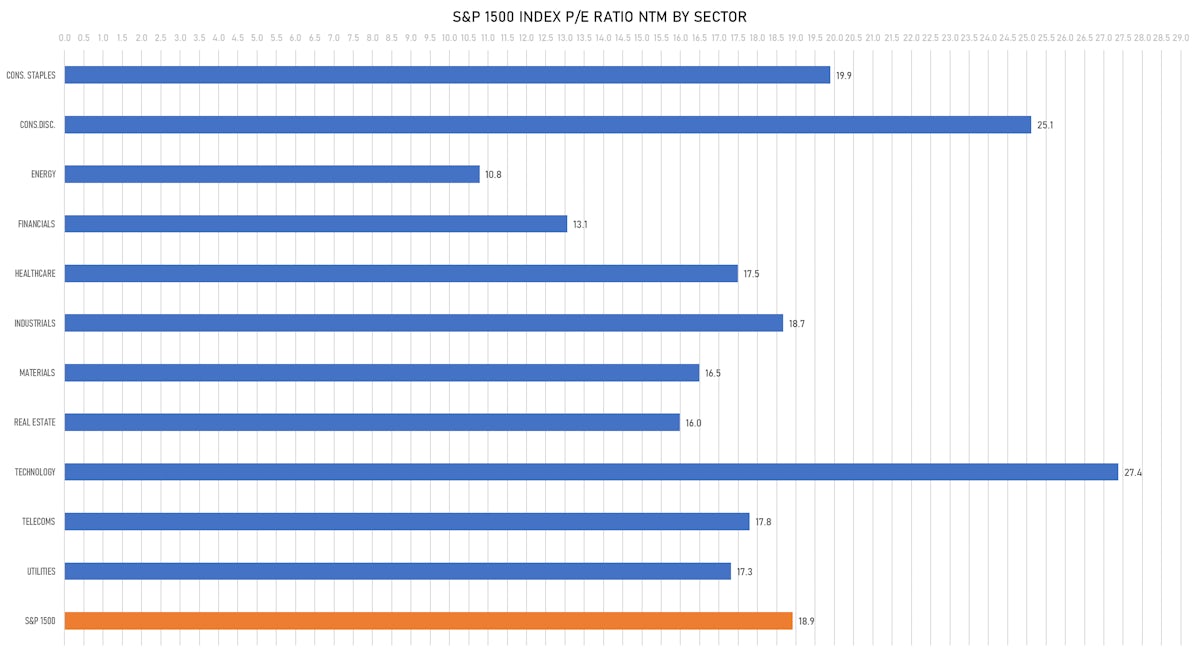
VALUATION MULTIPLES BY SECTORS
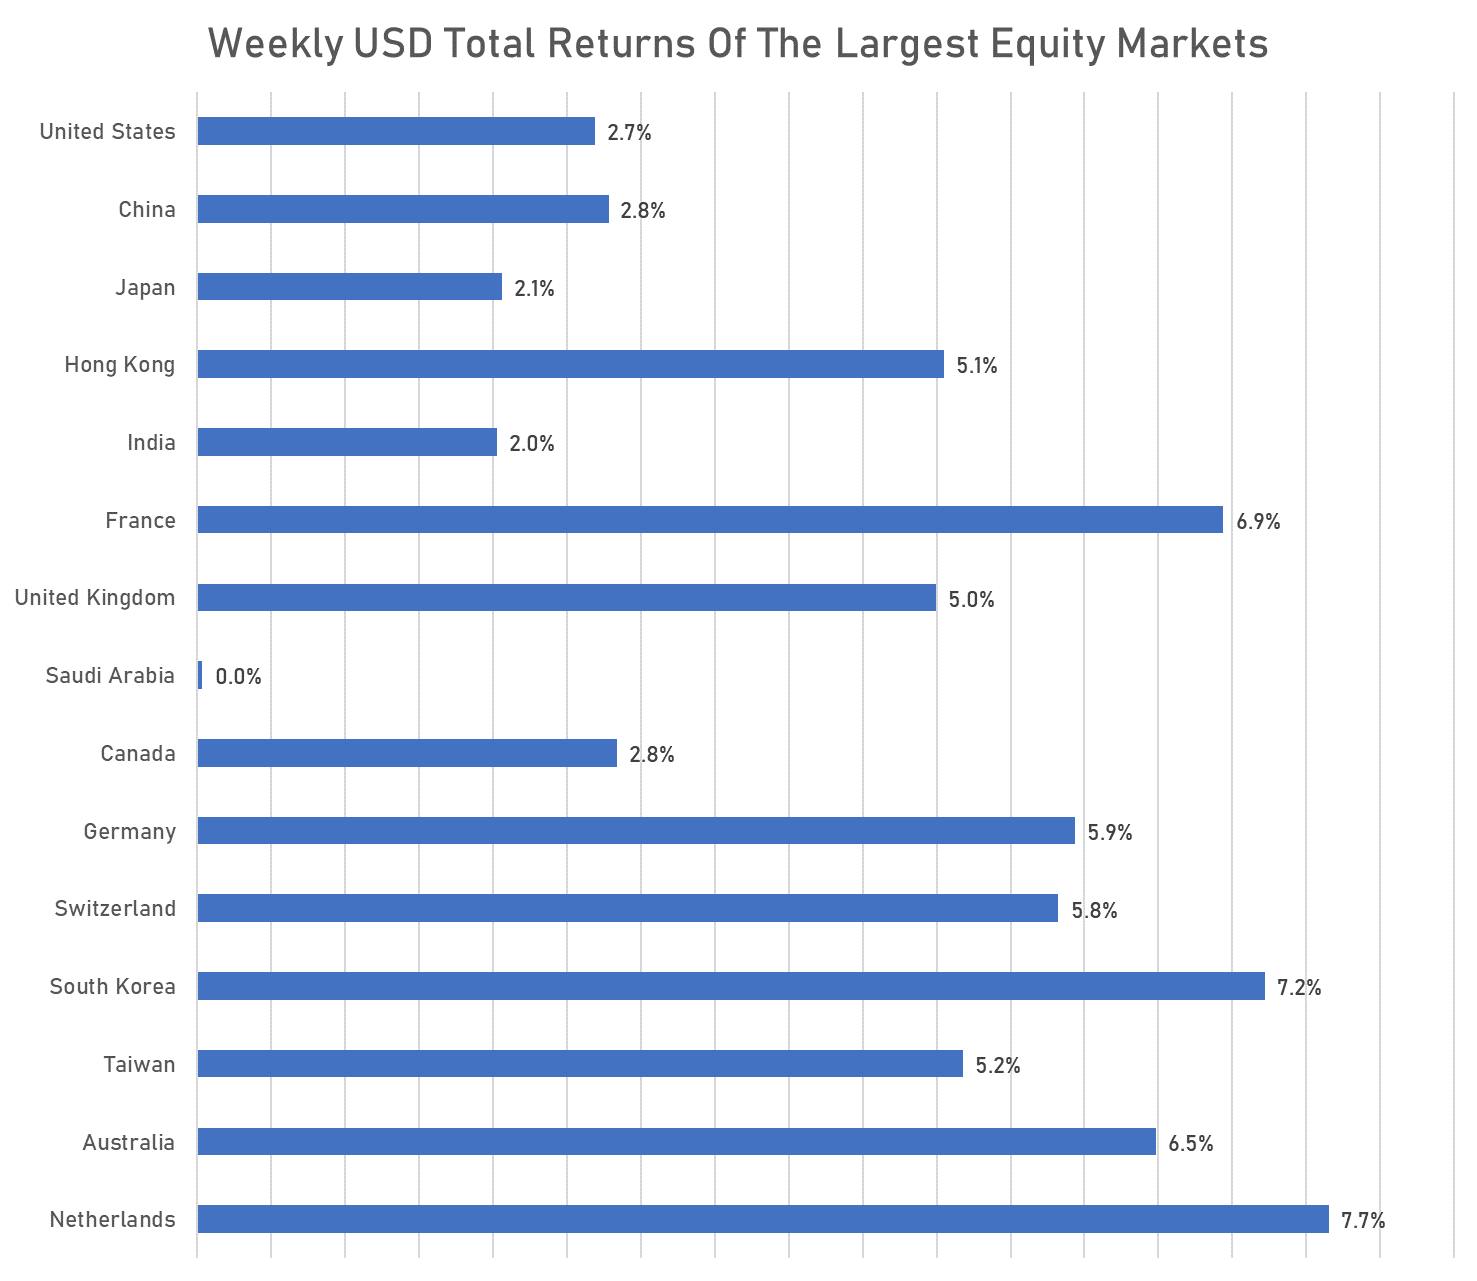
WEEKLY TOTAL RETURNS OF MAJOR GLOBAL EQUITY MARKETS
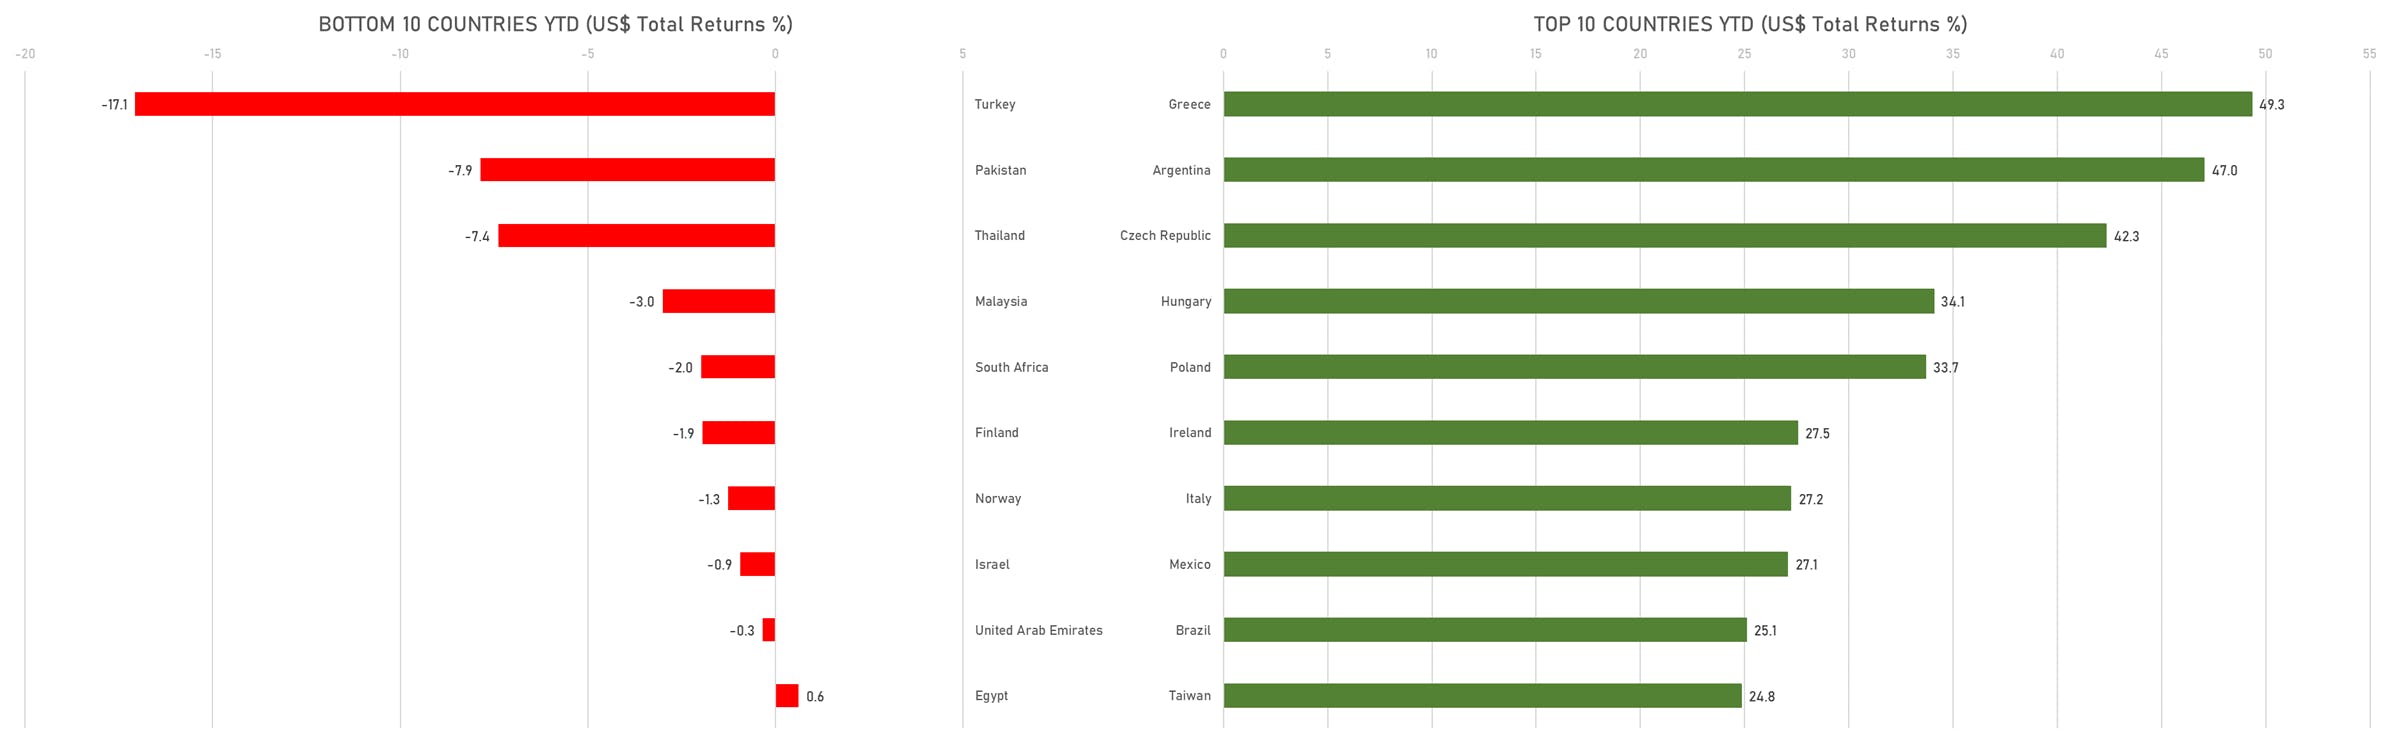
TOP / BOTTOM PERFORMING WORLD MARKETS YTD
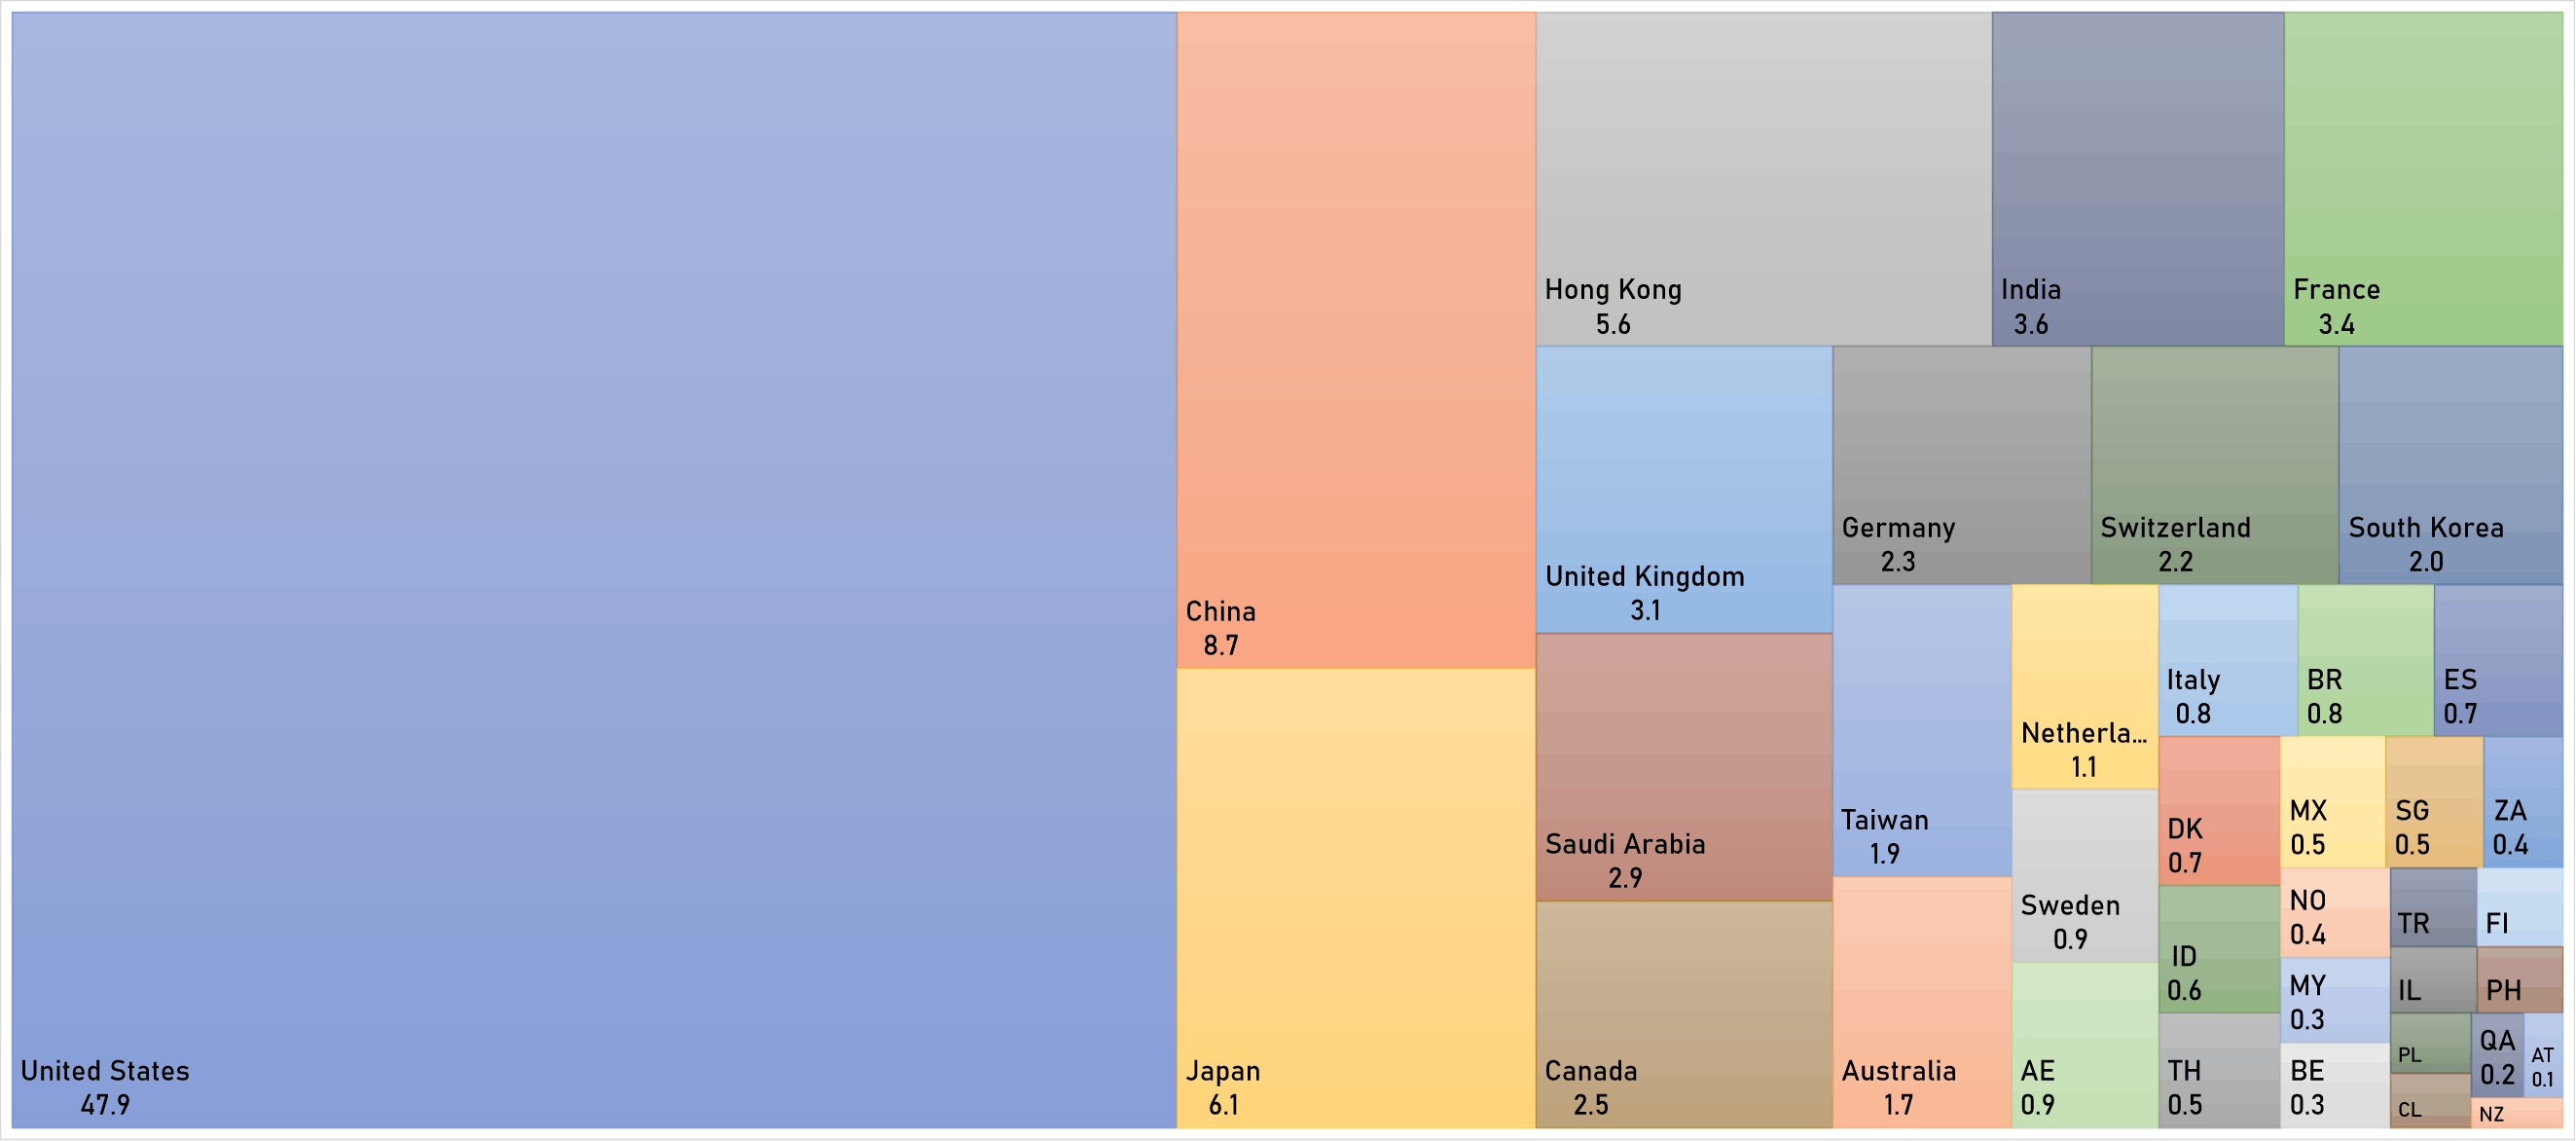
WORLD MARKET CAPITALIZATION (US$ Trillion)