Equities
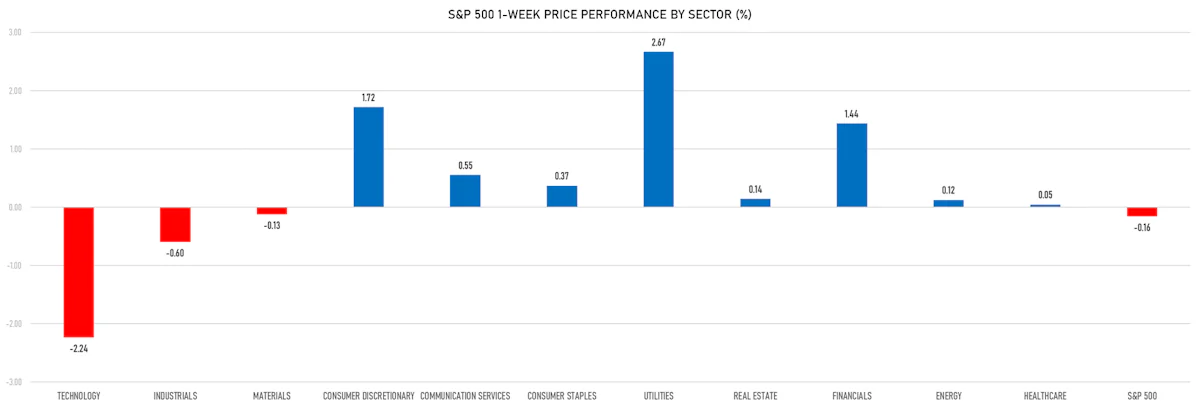
Sideways Price Action For US Equities This Week, Dragged Down By Technology Stocks
Chinese equities saw a slight rebound (US$ total returns), although the real estate sector continues to underperform, with enduring concerns about possible LGFV defaults
Published ET
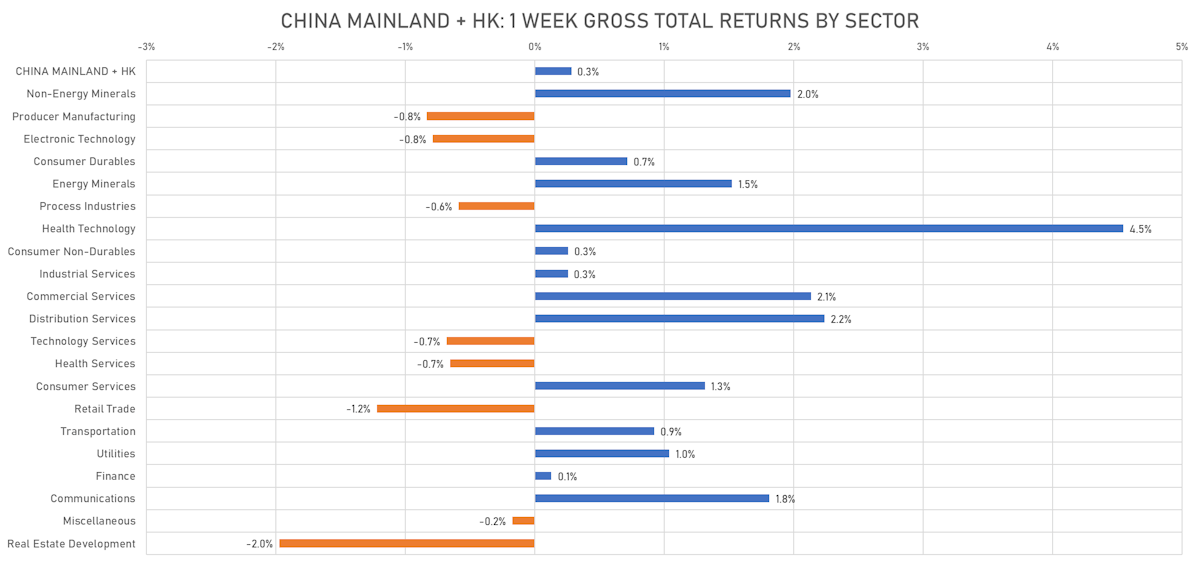
Chinese Equities Over The Past Week | Sources: phipost.com, FactSet data
DAILY SUMMARY
- Daily performance of US indices: S&P 500 down -1.22%; Nasdaq Composite down -1.56%; Wilshire 5000 down -0.62%
- 18.5% of S&P 500 stocks were up today, with 50.3% of stocks above their 200-day moving average (DMA) and 33.0% above their 50-DMA
- Top performing sectors in the S&P 500: utilities down -0.49% and real estate down -0.51%
- Bottom performing sectors in the S&P 500: technology down -1.95% and consumer discretionary down -1.88%
- The number of shares in the S&P 500 traded today was 2087m for a total turnover of US$ 203 bn
- The S&P 500 Value Index Index was down -1.1%, while the S&P 500 Growth Index Index was down -1.3%; the S&P small caps index was down -0.8% and mid caps were down -0.9%
- The volume on CME's INX (S&P 500 Index) was 4,245.0m (3-month z-score: 4.3); the 3-month average volume is 2,284.6m and the 12-month range is 903.0 - 5,761.3m
- Daily performance of international indices: Europe Stoxx 600 up 0.23%; UK FTSE 100 up 0.50%; Hang Seng SH-SZ-HK 300 Index down -0.21%; Japan's TOPIX 500 up 0.99%
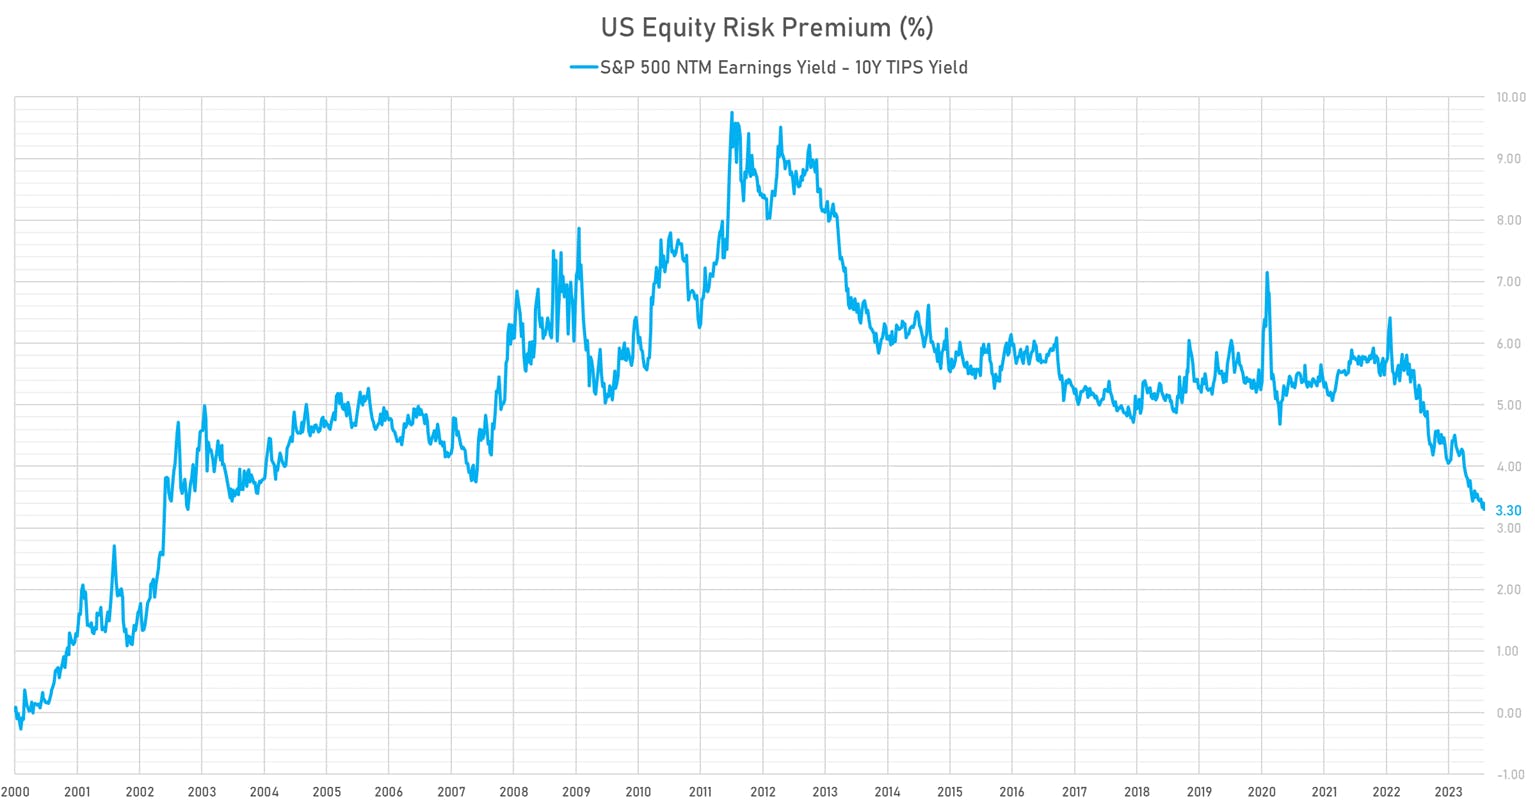
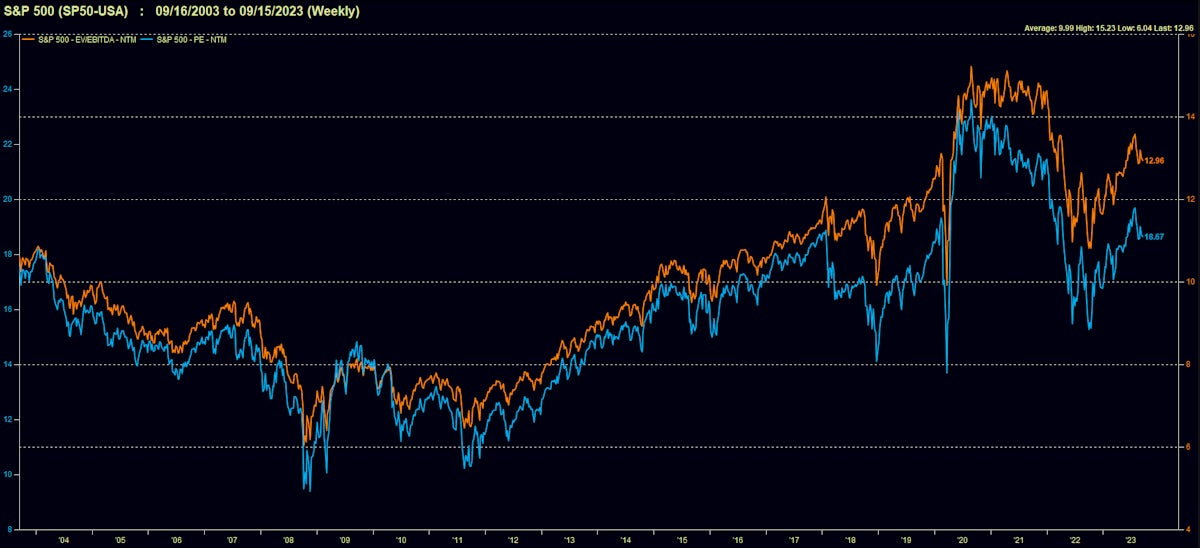
US Equity risk premium | Sources: phipost.com, FactSet & Refinitiv data
VOLATILITY TODAY
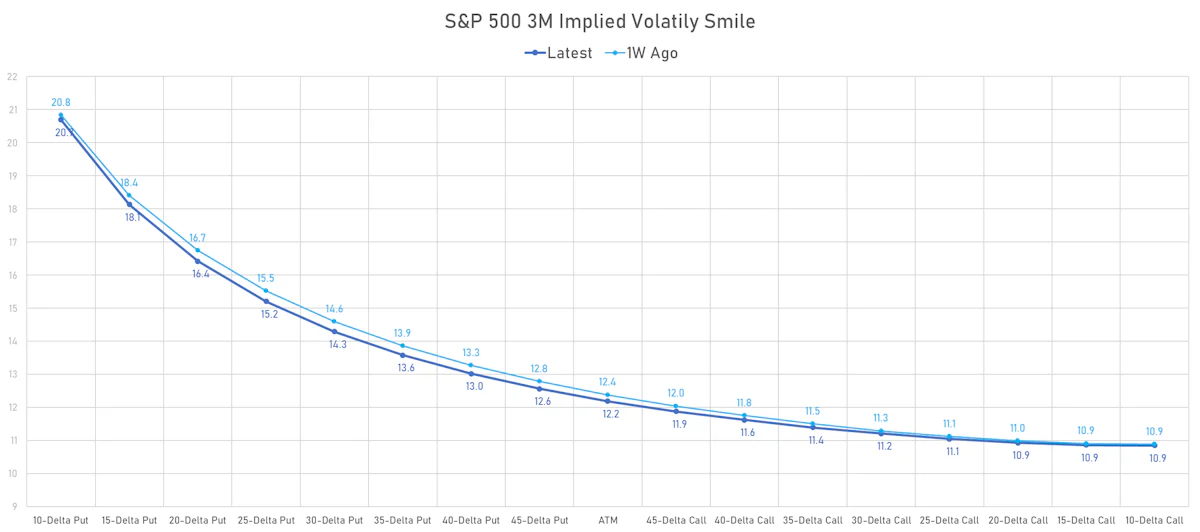
- 3-month at-the-money implied volatility on the S&P 500 at 10.2%, up from 9.8%
- 3-month at-the-money implied volatility on the STOXX Europe 600 at 10.6%, up from 10.6%
TOP WINNERS TODAY
- MSP Recovery Inc (LIFW), up 237.5% to $0.19 / YTD price return: -88.2% / 12-Month Price Range: $ 0.04-1.74 / Short interest (% of float): 2.2%; days to cover: 0.9
- RayzeBio Inc (RYZB), up 33.3% to $24.00 / 12-Month Price Range: $ #N/A-24.00
- NOVONIX Ltd (NVX), up 28.0% to $2.38 / YTD price return: -42.0% / 12-Month Price Range: $ 1.77-8.26 / Short interest (% of float): 0.0%; days to cover: 0.7
- Qurate Retail Inc (QRTEB), up 26.4% to $6.70 / YTD price return: +32.1% / 12-Month Price Range: $ 3.69-13.56 / Short interest (% of float): 1.6%; days to cover: 2.2
- Orchestra Biomed Holdings Inc (OBIO), up 24.6% to $7.05 / YTD price return: -29.4% / 12-Month Price Range: $ 4.85-23.39 / Short interest (% of float): 3.2%; days to cover: 8.6
- Allego NV (ALLG), up 19.8% to $2.78 / YTD price return: -11.5% / 12-Month Price Range: $ 1.55-6.26 / Short interest (% of float): 0.1%; days to cover: 4.2 (the stock is currently on the short sale restriction list)
- Bitdeer Technologies Group (BTDR), up 18.2% to $13.00 / 12-Month Price Range: $ 4.60-14.75 / Short interest (% of float): 0.3%; days to cover: 0.8
- Aurora Cannabis Inc (ACB), up 16.6% to $0.98 / YTD price return: +6.5% / 12-Month Price Range: $ 0.43-1.62 / Short interest (% of float): 7.8%; days to cover: 5.6
- Waldencast PLC (WALD), up 14.8% to $7.59 / 12-Month Price Range: $ 5.00-12.10 / Short interest (% of float): 3.0%; days to cover: 9.2
- Beneficient (BENF), up 14.6% to $2.90 / YTD price return: -71.7% / 12-Month Price Range: $ 1.69-16.50 / Short interest (% of float): 0.1%; days to cover: 0.5 (the stock is currently on the short sale restriction list)
BIGGEST LOSERS TODAY
- PTC Therapeutics Inc (PTCT), down 29.8% to $26.26 / YTD price return: -31.2% / 12-Month Price Range: $ 26.26-59.84 / Short interest (% of float): 10.1%; days to cover: 12.9 (the stock is currently on the short sale restriction list)
- Planet Fitness Inc (PLNT), down 15.9% to $50.29 / YTD price return: -36.2% / 12-Month Price Range: $ 50.29-85.91 / Short interest (% of float): 5.6%; days to cover: 3.4 (the stock is currently on the short sale restriction list)
- P3 Health Partners Inc (PIII), down 14.5% to $2.07 / YTD price return: +12.5% / 12-Month Price Range: $ .70-6.54 / Short interest (% of float): 4.0%; days to cover: 9.1 (the stock is currently on the short sale restriction list)
- FingerMotion Inc (FNGR), down 14.0% to $6.04 / YTD price return: +114.9% / 12-Month Price Range: $ .62-9.80 / Short interest (% of float): 1.5%; days to cover: 0.8 (the stock is currently on the short sale restriction list)
- Vasta Platform Ltd (VSTA), down 13.2% to $3.56 / YTD price return: -11.0% / 12-Month Price Range: $ 3.05-5.58 / Short interest (% of float): 0.6%; days to cover: 2.6 (the stock is currently on the short sale restriction list)
- GDEV Inc. (GDEV), down 12.3% to $3.29 / YTD price return: -48.4% / 12-Month Price Range: $ 3.10-8.50 / Short interest (% of float): 0.2%; days to cover: 4.5 (the stock is currently on the short sale restriction list)
- Zura Bio Ltd (ZURA), down 11.9% to $6.06 / YTD price return: -40.6% / 12-Month Price Range: $ 4.87-37.55 / Short interest (% of float): 0.8%; days to cover: 1.6 (the stock is currently on the short sale restriction list)
- DocGo Inc (DCGO), down 11.8% to $5.70 / YTD price return: -19.4% / 12-Month Price Range: $ 5.70-11.41 / Short interest (% of float): 13.4%; days to cover: 15.7 (the stock is currently on the short sale restriction list)
- Lindsay Corp (LNN), down 10.7% to $114.19 / YTD price return: -29.9% / 12-Month Price Range: $ 110.43-183.08 / Short interest (% of float): 2.0%; days to cover: 3.5 (the stock is currently on the short sale restriction list)
- Iris Energy Ltd (IREN), down 10.4% to $4.49 / YTD price return: +259.2% / 12-Month Price Range: $ 1.02-8.06 / Short interest (% of float): 1.2%; days to cover: 0.5 (the stock is currently on the short sale restriction list)
TOP S&P 500 PERFORMERS THIS WEEK
- Tesla Inc (TSLA), up 10.4% to $274.39 / YTD price return: +122.8% / 12-Month Price Range: $ 101.83-313.80 / Short interest (% of float): 3.0%; days to cover: 0.7
- PNC Financial Services Group Inc (PNC), up 8.1% to $126.35 / YTD price return: -20.0% / 12-Month Price Range: $ 110.31-170.18 / Short interest (% of float): 1.5%; days to cover: 3.0
- CVS Health Corp (CVS), up 7.6% to $70.87 / YTD price return: -24.0% / 12-Month Price Range: $ 64.63-104.60
- Qualcomm Inc (QCOM), up 6.6% to $113.14 / YTD price return: +2.9% / 12-Month Price Range: $ 101.48-139.94
- Moderna Inc (MRNA), up 6.5% to $114.59 / YTD price return: -36.2% / 12-Month Price Range: $ 95.02-217.20 / Short interest (% of float): 5.3%; days to cover: 4.2
- Revvity Inc (RVTY), up 6.2% to $113.44 / YTD price return: -19.1% / 12-Month Price Range: $ 105.97-150.16 / Short interest (% of float): 2.4%; days to cover: 3.9
- M&T Bank Corp (MTB), up 6.2% to $129.30 / YTD price return: -10.9% / 12-Month Price Range: $ 109.60-192.50 / Short interest (% of float): 2.5%; days to cover: 5.1
- Charter Communications Inc (CHTR), up 6.0% to $447.95 / YTD price return: +32.1% / 12-Month Price Range: $ 297.83-452.25 / Short interest (% of float): 8.8%; days to cover: 6.3
- Corteva Inc (CTVA), up 6.0% to $52.55 / YTD price return: -10.6% / 12-Month Price Range: $ 48.68-68.43 / Short interest (% of float): 0.8%; days to cover: 1.5
- AT&T Inc (T), up 5.8% to $15.23 / YTD price return: -17.3% / 12-Month Price Range: $ 13.44-20.50 / Short interest (% of float): 1.6%; days to cover: 2.9
BOTTOM S&P 500 PERFORMERS THIS WEEK
- J M Smucker Co (SJM), down 10.4% to $126.83 / YTD price return: -20.0% / 12-Month Price Range: $ 126.27-163.06
- Netflix Inc (NFLX), down 10.4% to $396.94 / YTD price return: +34.6% / 12-Month Price Range: $ 211.81-485.00 / Short interest (% of float): 2.0%; days to cover: 1.6
- Oracle Corp (ORCL), down 9.8% to $113.91 / YTD price return: +39.4% / 12-Month Price Range: $ 60.79-127.54 / Short interest (% of float): 1.0%; days to cover: 2.1
- RTX Corp (RTX), down 9.2% to $75.80 / YTD price return: -24.9% / 12-Month Price Range: $ 73.66-104.90 / Short interest (% of float): 0.6%; days to cover: 1.1
- Dollar General Corp (DG), down 9.1% to $115.68 / YTD price return: -53.0% / 12-Month Price Range: $ 115.68-261.52 / Short interest (% of float): 2.1%; days to cover: 1.7
- KLA Corp (KLAC), down 8.7% to $454.22 / YTD price return: +20.5% / 12-Month Price Range: $ 250.74-520.00 / Short interest (% of float): 1.6%; days to cover: 2.2
- CBRE Group Inc (CBRE), down 8.0% to $78.42 / YTD price return: +1.9% / 12-Month Price Range: $ 66.34-89.57 / Short interest (% of float): 2.4%; days to cover: 5.5
- Eaton Corporation PLC (ETN), down 7.8% to $217.64 / YTD price return: +38.7% / 12-Month Price Range: $ 129.85-240.39 / Short interest (% of float): 1.1%; days to cover: 2.3
- Illumina Inc (ILMN), down 7.7% to $146.15 / YTD price return: -27.7% / 12-Month Price Range: $ 146.15-248.48 / Short interest (% of float): 3.6%; days to cover: 4.2
- Dexcom Inc (DXCM), down 7.7% to $96.35 / YTD price return: -14.9% / 12-Month Price Range: $ 78.97-139.51 / Short interest (% of float): 4.4%
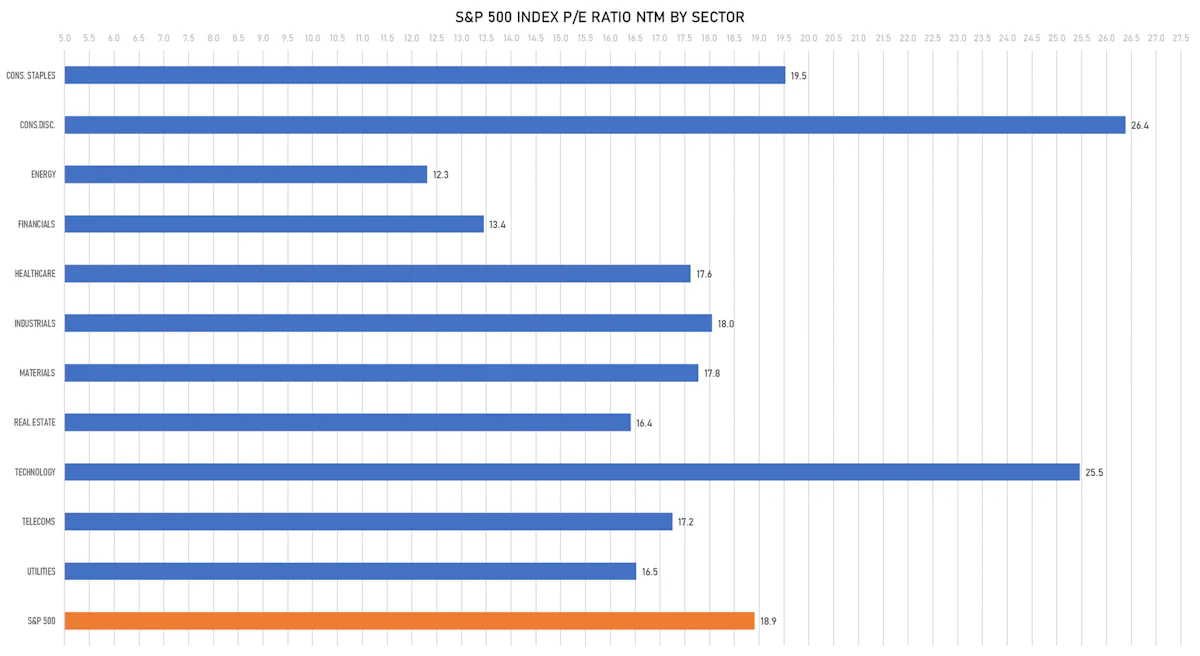
VALUATION MULTIPLES BY SECTORS
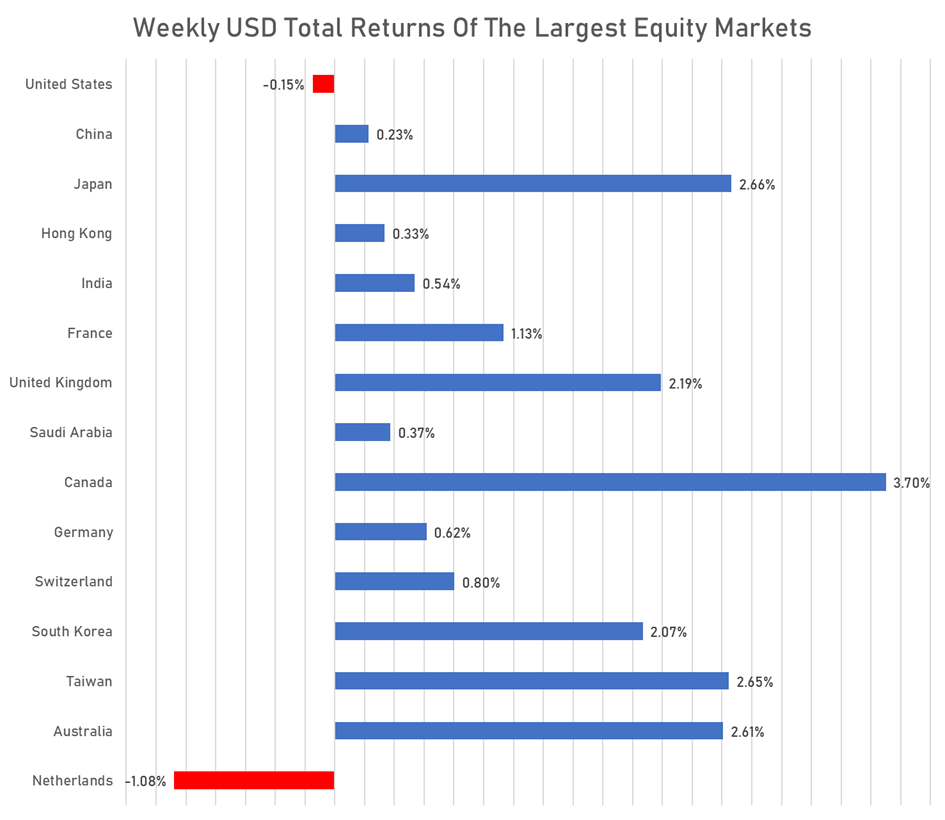
WEEKLY TOTAL RETURNS OF MAJOR GLOBAL EQUITY MARKETS
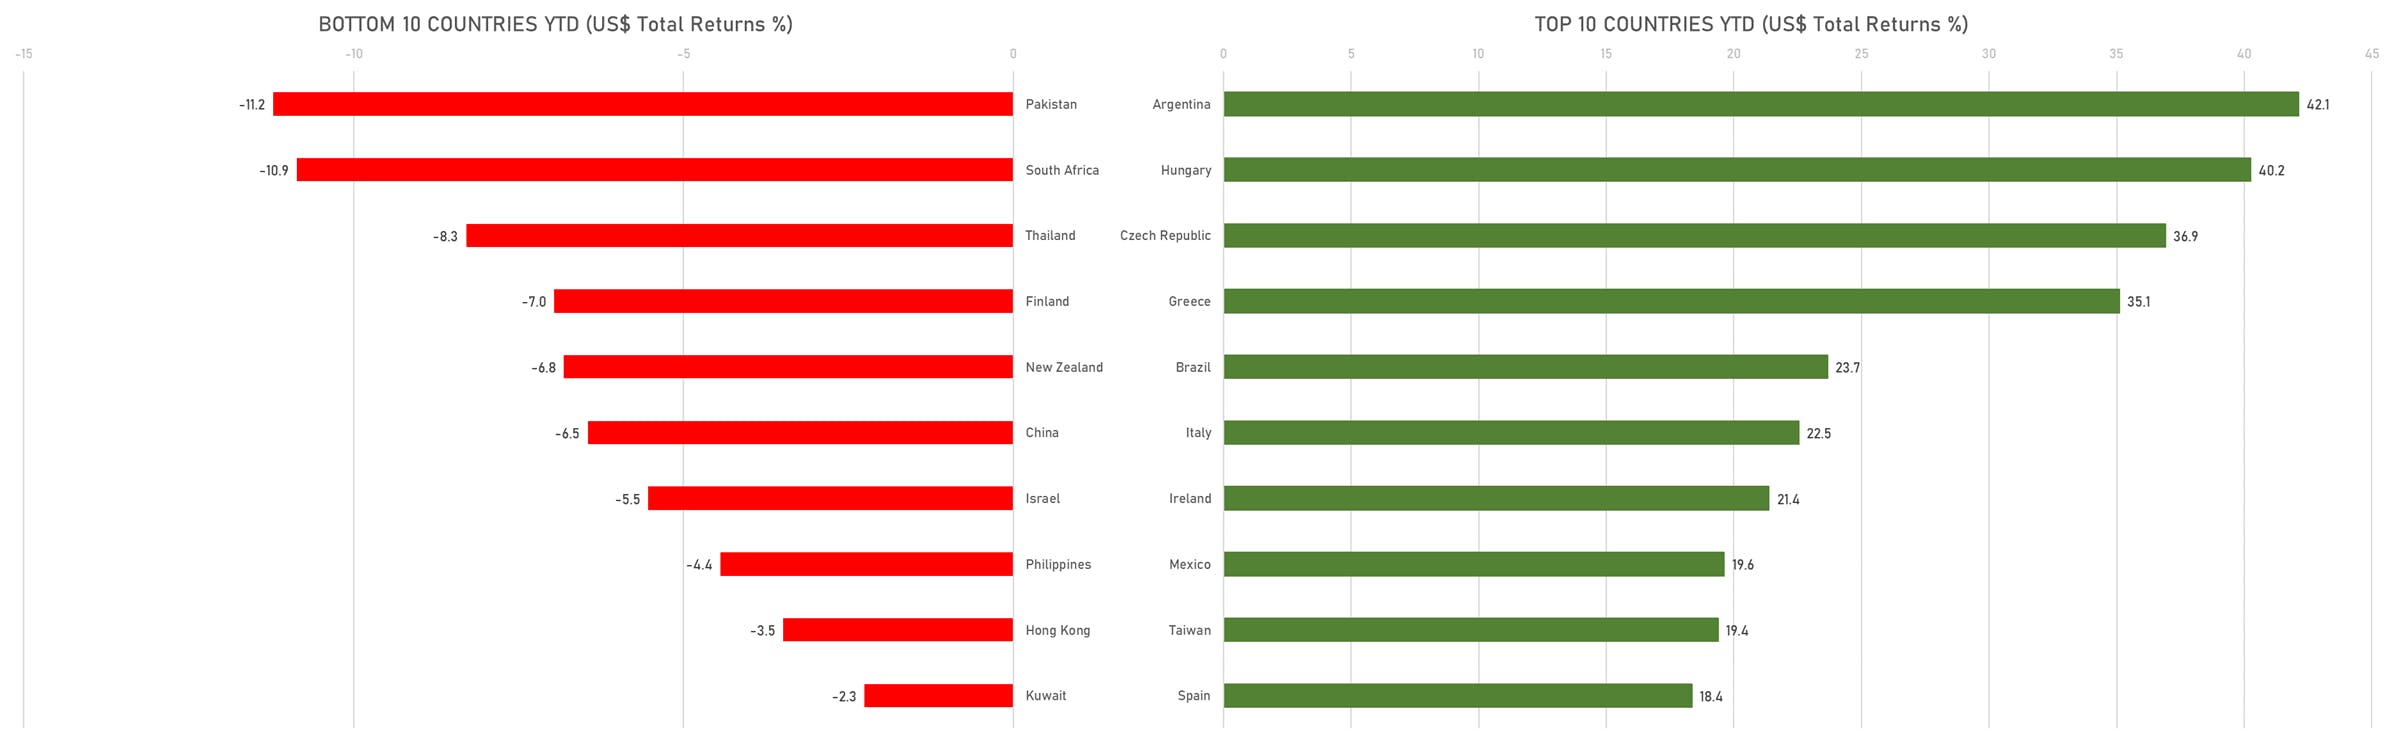
TOP / BOTTOM PERFORMING WORLD MARKETS YTD
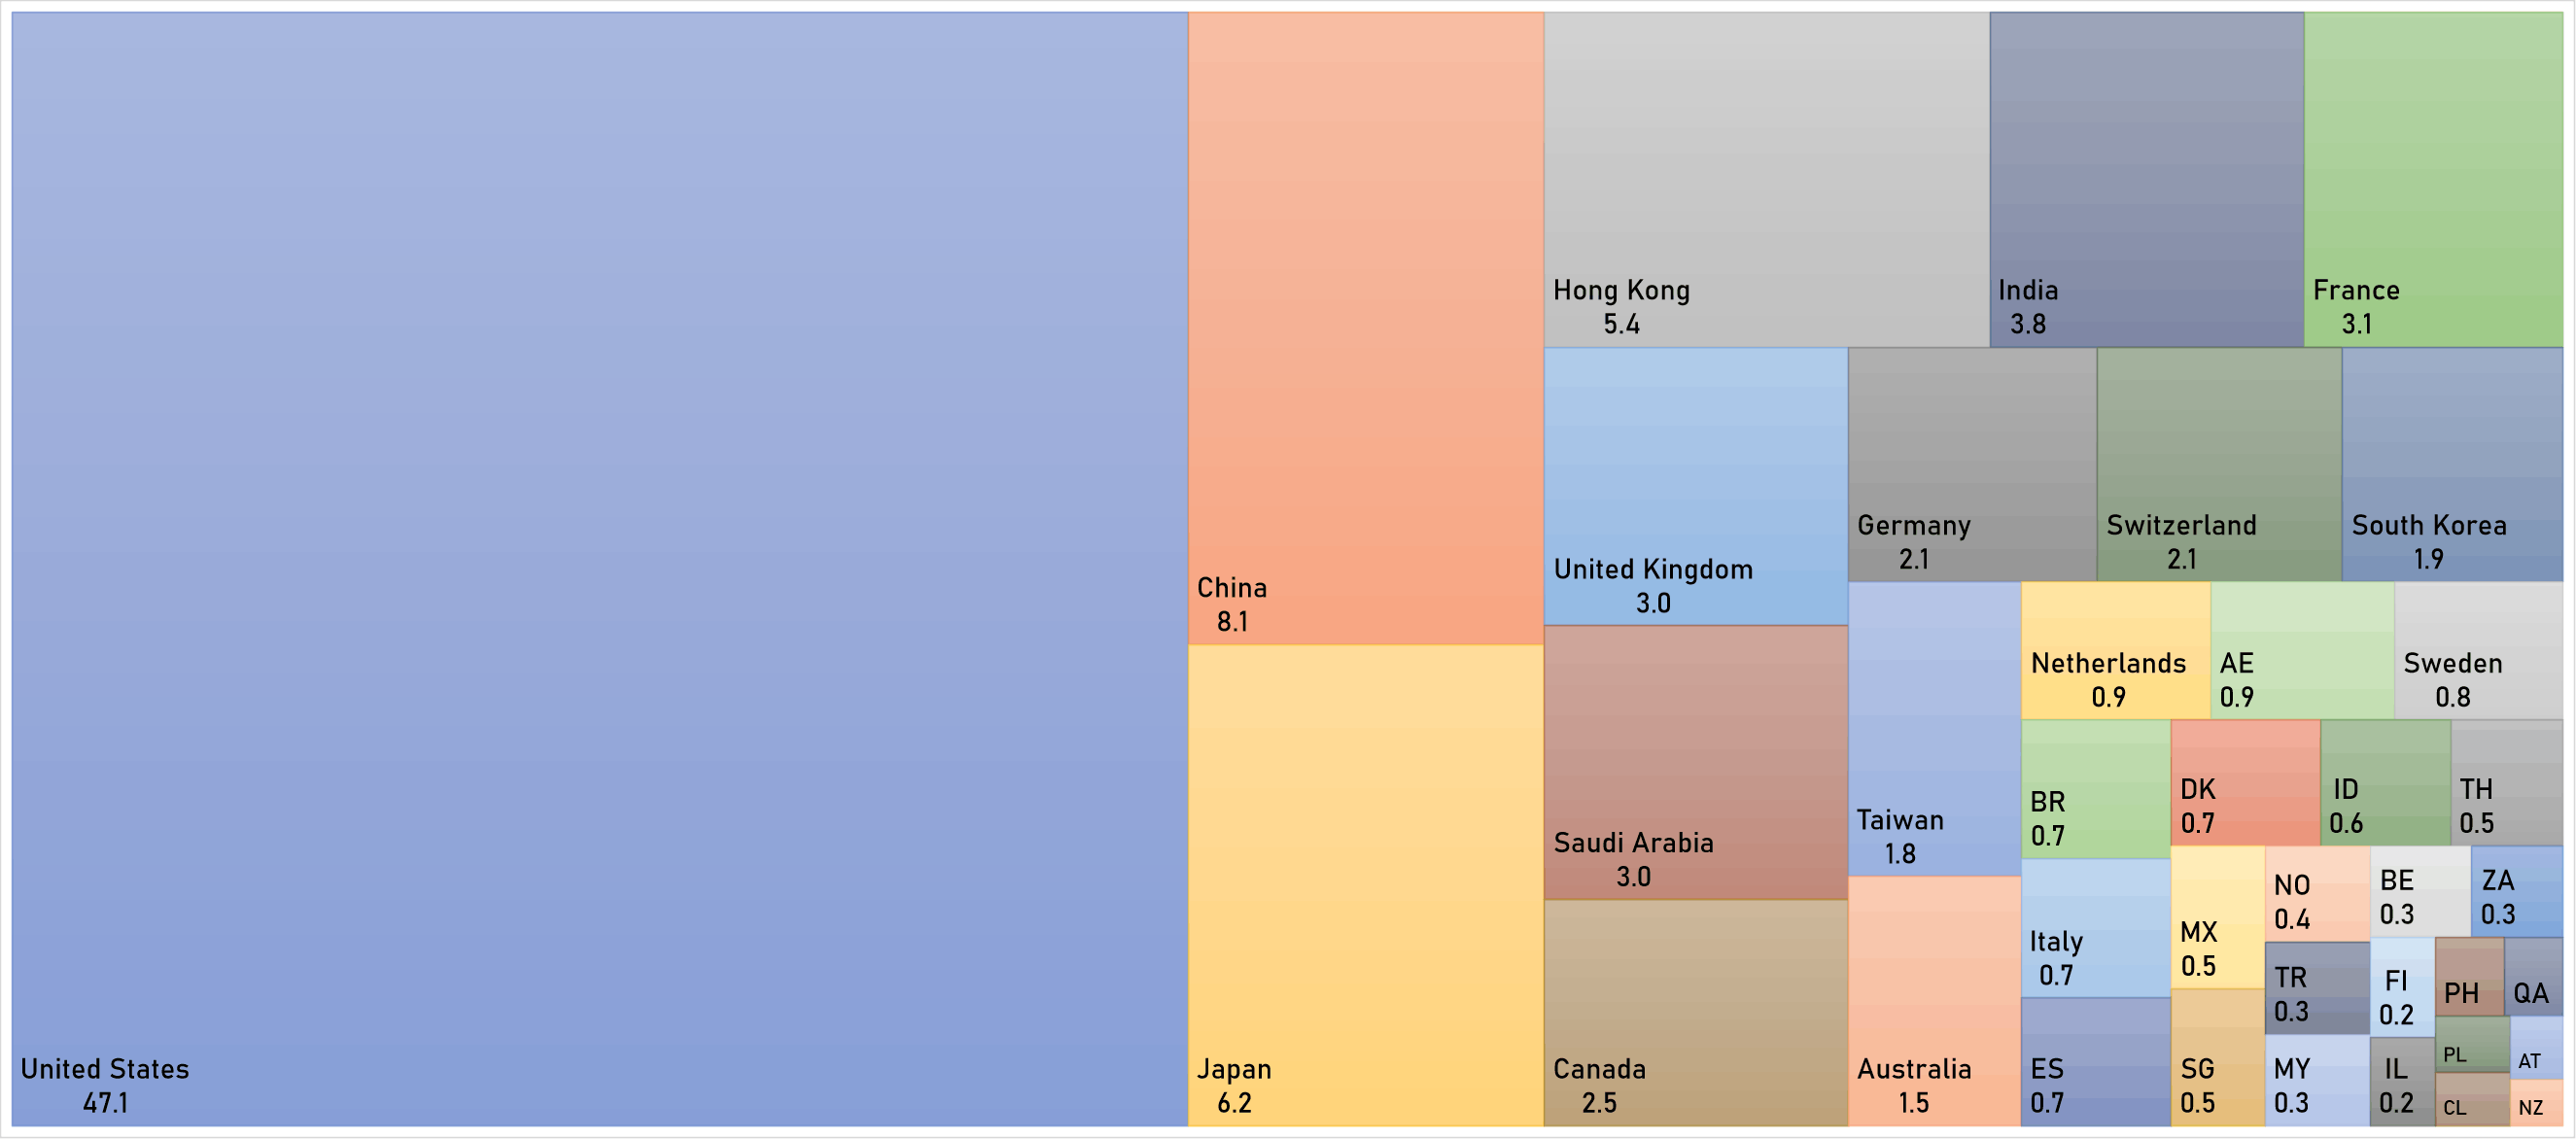
WORLD MARKET CAPITALIZATION (US$ Trillion)