Equities
Rates Weigh On Bond Proxies, With S&P 500 Utilities Falling Close To 7% This Week
We're starting to see extreme oversold conditions that could lead to a decent rebound, with the S&P 500 currently over 2.5 standard deviations below its 50-day moving average
Published ET
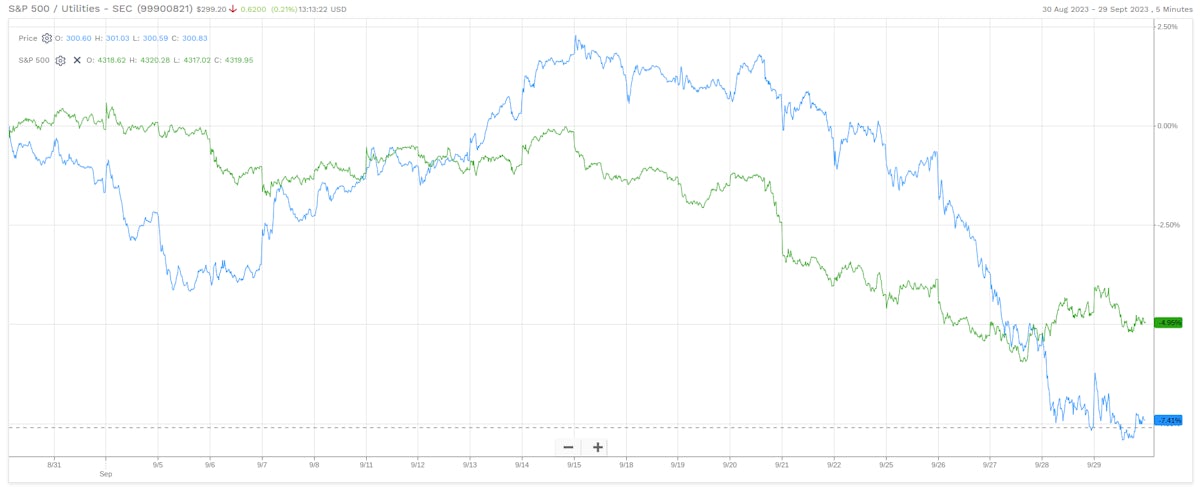
S&P 500 Utilities vs S&P 500 | Source: FactSet
DAILY SUMMARY
- Daily performance of US indices: S&P 500 down -0.27%; Nasdaq Composite up 0.14%; Wilshire 5000 up 0.02%
- 37.4% of S&P 500 stocks were up today, with 39.8% of stocks above their 200-day moving average (DMA) and 14.9% above their 50-DMA
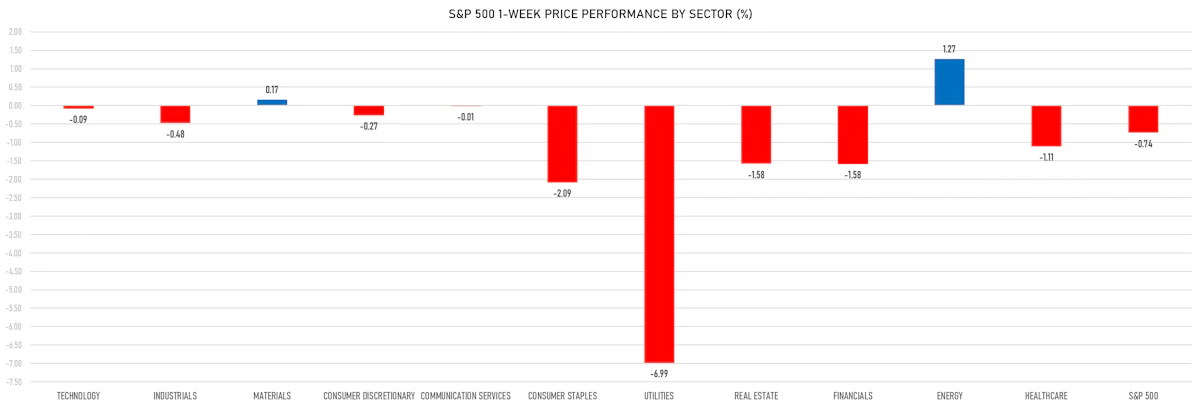
- Top performing sectors in the S&P 500: consumer discretionary up 0.53% and technology up 0.39%
- Bottom performing sectors in the S&P 500: energy down -1.97% and financials down -0.88%
- The number of shares in the S&P 500 traded today was 736m for a total turnover of US$ 75 bn
- The S&P 500 Value Index was down -0.3%, while the S&P 500 Growth Index was down -0.3%; the S&P small caps index was down -0.4% and mid-caps were down -0.1%
- The volume on CME's INX (S&P 500 Index) was 2,411.0m (3-month z-score: 0.5); the 3-month average volume is 2,216.8m and the 12-month range is 903.0 - 5,761.3m
- Daily performance of international indices: Europe Stoxx 600 up 0.38%; UK FTSE 100 up 0.08%; Hang Seng SH-SZ-HK 300 Index up 1.07%; Japan's TOPIX 500 down -0.93%
VOLATILITY TODAY
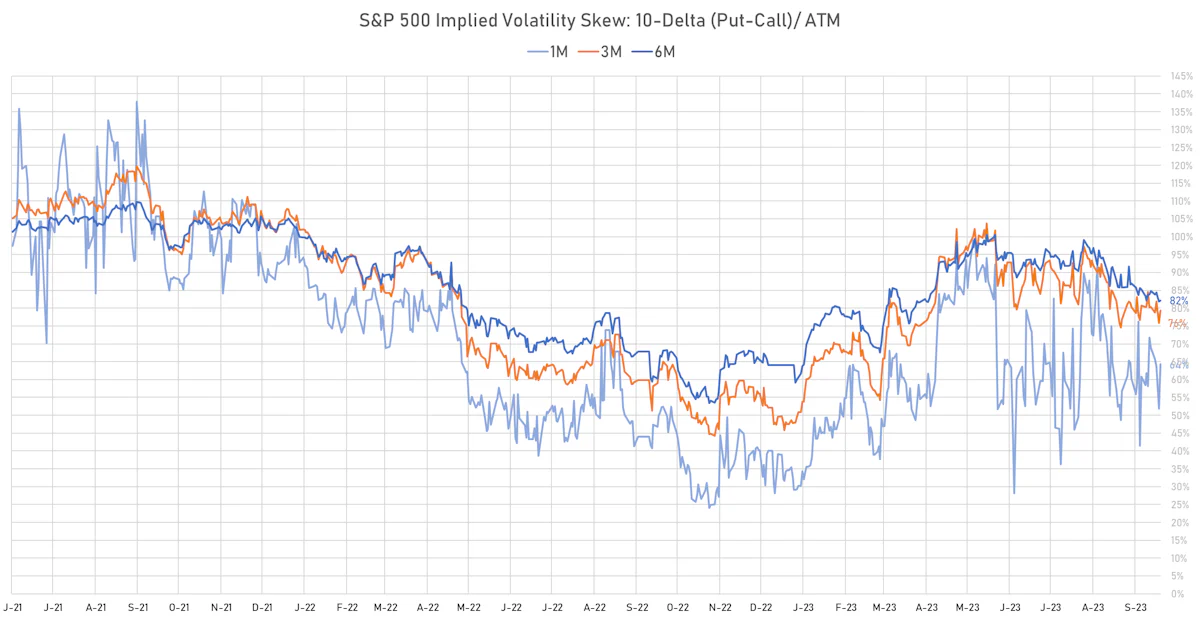
- 3-month at-the-money implied volatility on the S&P 500 at 14.0%, up from 14.0%
- 3-month at-the-money implied volatility on the STOXX Europe 600 at 13.1%, down from 14.1%
NOTABLE US EARNINGS RELEASES TODAY
- Vail Resorts Inc (MTN | Consumer Cyclicals): missed EPS median estimate (-3.35 act. vs. -3.28 est.) and missed revenue median estimate (270m act. vs. 279m est.), down -8.40% today, closed at $ 221.89 / share and traded at $ 222.16 (+0.12%) after hours
TOP WINNERS TODAY
- Structure Therapeutics Inc (GPCR), up 34.6% to $50.42 / 12-Month Price Range: $ 20.80-50.42 / Short interest (% of float): 6.4%; days to cover: 4.0
- Groupon Inc (GRPN), up 14.7% to $15.32 / YTD price return: +78.6% / 12-Month Price Range: $ 2.89-15.32 / Short interest (% of float): 20.6%; days to cover: 3.7
- GigaCloud Technology Inc (GCT), up 14.6% to $8.81 / YTD price return: +54.8% / 12-Month Price Range: $ 4.14-18.60 / Short interest (% of float): 7.2%; days to cover: 1.1
- Orchestra Biomed Holdings Inc (OBIO), up 13.2% to $8.72 / YTD price return: -12.6% / 12-Month Price Range: $ 4.85-23.39 / Short interest (% of float): 3.3%; days to cover: 4.2
- Editas Medicine Inc (EDIT), up 12.7% to $7.80 / YTD price return: -12.1% / 12-Month Price Range: $ 6.33-14.23 / Short interest (% of float): 18.7%; days to cover: 12.5
- Similarweb Ltd (SMWB), up 12.1% to $6.48 / YTD price return: +0.8% / 12-Month Price Range: $ 4.37-7.95 / Short interest (% of float): 1.6%; days to cover: 7.1
- Newegg Commerce Inc (NEGG), up 11.5% to $0.85 / YTD price return: -35.5% / 12-Month Price Range: $ 0.75-3.09 / Short interest (% of float): 6.2%; days to cover: 5.4
- Waldencast PLC (WALD), up 11.3% to $9.42 / 12-Month Price Range: $ 5.00-12.10 / Short interest (% of float): 1.6%; days to cover: 4.2
- Tigo Energy Inc (TYGO), up 10.9% to $7.01 / YTD price return: -31.3% / 12-Month Price Range: $ 6.20-27.00 / Short interest (% of float): 0.3%; days to cover: 0.5
- Ambipar Emergency Response (AMBI), up 10.2% to $6.92 / YTD price return: -29.9% / 12-Month Price Range: $ 5.26-50.50 / Short interest (% of float): 0.7%; days to cover: 2.9
BIGGEST LOSERS TODAY
- Lifezone Metals Ltd (LZM), down 20.8% to $12.27 / YTD price return: +18.2% / 12-Month Price Range: $ 8.32-19.92 / Short interest (% of float): 0.6%; days to cover: 6.8 (the stock is currently on the short sale restriction list)
- Corcept Therapeutics Inc (CORT), down 17.4% to $27.25 / YTD price return: +34.1% / 12-Month Price Range: $ 17.86-34.28 / Short interest (% of float): 16.0%; days to cover: 22.6 (the stock is currently on the short sale restriction list)
- Opera Ltd (OPRA), down 13.6% to $11.27 / YTD price return: +101.1% / 12-Month Price Range: $ 3.49-28.58 / Short interest (% of float): 1.3%; days to cover: 1.2 (the stock is currently on the short sale restriction list)
- United Homes Group Inc (UHG), down 12.8% to $5.60 / YTD price return: -44.3% / 12-Month Price Range: $ 5.60-29.00 / Short interest (% of float): 3.4%; days to cover: 9.5 (the stock is currently on the short sale restriction list)
- Lanzatech Global Inc (LNZA), down 11.9% to $4.67 / YTD price return: -53.2% / 12-Month Price Range: $ 2.63-10.80 / Short interest (% of float): 1.1%; days to cover: 4.3 (the stock is currently on the short sale restriction list)
- Cheche Group Inc (CCG), down 11.8% to $10.69 / YTD price return: +4.2% / 12-Month Price Range: $ 8.50-200.00 (the stock is currently on the short sale restriction list)
- Pharming Group NV (PHAR), down 11.1% to $11.40 / YTD price return: +3.4% / 12-Month Price Range: $ 8.65-17.81 / Short interest (% of float): 0.0%; days to cover: 1.6 (the stock is currently on the short sale restriction list)
- American Oncology Network Inc (AONC), down 10.4% to $9.30 / YTD price return: -7.4% / 12-Month Price Range: $ 7.02-39.60 / Short interest (% of float): 0.0%; days to cover: 0.5 (the stock is currently on the short sale restriction list)
- M3-Brigade Acquisition III Corp (GFR), down 10.0% to $4.95 / YTD price return: -51.2% / 12-Month Price Range: $ 4.80-12.49 / Short interest (% of float): 0.0%; days to cover: 0.0 (the stock is currently on the short sale restriction list)
- Southland Holdings Inc (SLND), down 9.8% to $6.07 / 12-Month Price Range: $ 5.66-11.14 / Short interest (% of float): 2.3%; days to cover: 3.8
TOP S&P 500 PERFORMERS THIS WEEK
- Resmed Inc (RMD), up 8.2% to $147.87 / YTD price return: -29.0% / 12-Month Price Range: $ 136.20-243.27 / Short interest (% of float): 2.6%; days to cover: 2.0
- Trimble Inc (TRMB), up 7.2% to $53.86 / YTD price return: +6.5% / 12-Month Price Range: $ 45.45-62.40 / Short interest (% of float): 0.7%; days to cover: 1.3
- Advanced Micro Devices Inc (AMD), up 6.9% to $102.82 / YTD price return: +58.7% / 12-Month Price Range: $ 54.58-132.80 / Short interest (% of float): 1.9%; days to cover: 0.5
- Dexcom Inc (DXCM), up 6.6% to $93.30 / YTD price return: -17.6% / 12-Month Price Range: $ 80.36-139.51 / Short interest (% of float): 4.2%; days to cover: 3.7
- Steel Dynamics Inc (STLD), up 6.1% to $107.22 / YTD price return: +9.7% / 12-Month Price Range: $ 69.87-136.45 / Short interest (% of float): 3.8%; days to cover: 4.7
- GE Healthcare Technologies Inc (GEHC), up 5.8% to $68.04 / YTD price return: +16.5% / 12-Month Price Range: $ 53.00-87.80 / Short interest (% of float): 3.1%; days to cover: 4.8
- EQT Corp (EQT), up 5.5% to $40.58 / YTD price return: +20.0% / 12-Month Price Range: $ 28.11-45.91 / Short interest (% of float): 6.5%; days to cover: 5.1
- Teradyne Inc (TER), up 5.3% to $100.46 / YTD price return: +15.0% / 12-Month Price Range: $ 67.81-119.05 / Short interest (% of float): 3.2%; days to cover: 3.4
- Walgreens Boots Alliance Inc (WBA), up 5.3% to $22.24 / YTD price return: -40.5% / 12-Month Price Range: $ 20.59-42.29 / Short interest (% of float): 6.9%; days to cover: 4.1
- Nike Inc (NKE), up 5.3% to $95.62 / YTD price return: -18.3% / 12-Month Price Range: $ 82.23-131.25 / Short interest (% of float): 1.4%; days to cover: 2.3
BOTTOM S&P 500 PERFORMERS THIS WEEK
- Nextera Energy Inc (NEE), down 15.4% to $57.29 / YTD price return: -31.5% / 12-Month Price Range: $ 56.99-88.61 / Short interest (% of float): 0.9%; days to cover: 2.1
- Newmont Corporation (NEM), down 9.3% to $36.95 / YTD price return: -21.7% / 12-Month Price Range: $ 36.61-55.40 / Short interest (% of float): 3.6%; days to cover: 4.1
- Carmax Inc (KMX), down 7.7% to $70.73 / YTD price return: +16.2% / 12-Month Price Range: $ 52.87-87.35 / Short interest (% of float): 11.5%; days to cover: 14.7 (the stock is currently on the short sale restriction list)
- NiSource Inc (NI), down 7.5% to $24.68 / YTD price return: -10.0% / 12-Month Price Range: $ 23.78-28.95 / Short interest (% of float): 1.7%; days to cover: 2.1
- Eversource Energy (ES), down 7.1% to $58.15 / YTD price return: -30.6% / 12-Month Price Range: $ 57.23-87.68 / Short interest (% of float): 1.1%; days to cover: 1.9
- Edison International (EIX), down 7.0% to $63.29 / YTD price return: -.5% / 12-Month Price Range: $ 54.51-74.91 / Short interest (% of float): 1.8%; days to cover: 4.7
- Ameren Corp (AEE), down 6.7% to $74.83 / YTD price return: -15.8% / 12-Month Price Range: $ 73.42-92.43 / Short interest (% of float): 1.5%; days to cover: 3.3
- Southern Co (SO), down 6.7% to $64.72 / YTD price return: -9.4% / 12-Month Price Range: $ 58.85-75.76 / Short interest (% of float): 1.0%; days to cover: 3.2
- DTE Energy Co (DTE), down 6.5% to $99.28 / YTD price return: -15.5% / 12-Month Price Range: $ 98.58-122.76 / Short interest (% of float): 1.4%; days to cover: 2.5
- Dominion Energy Inc (D), down 6.5% to $44.67 / YTD price return: -27.2% / 12-Month Price Range: $ 44.09-74.57 / Short interest (% of float): 0.9%; days to cover: 1.5
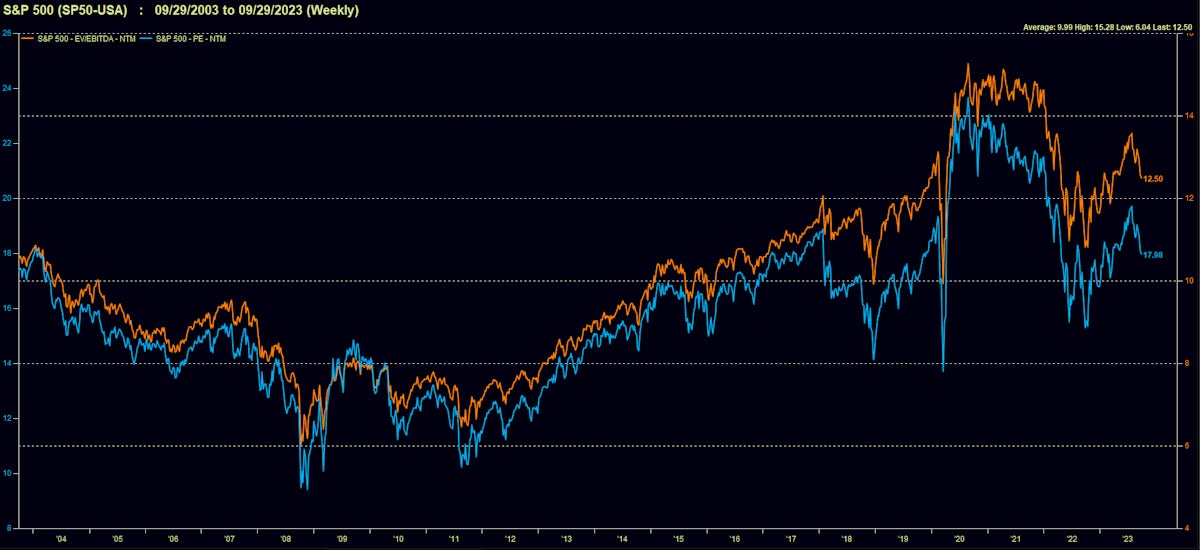
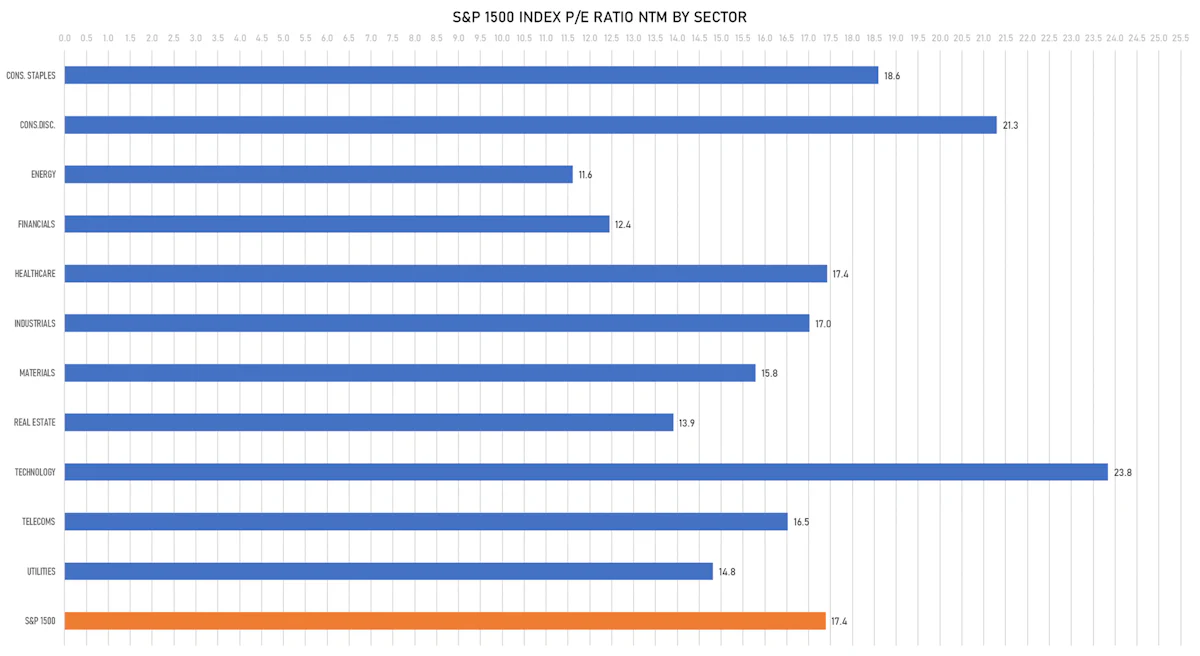
VALUATION MULTIPLES BY SECTORS
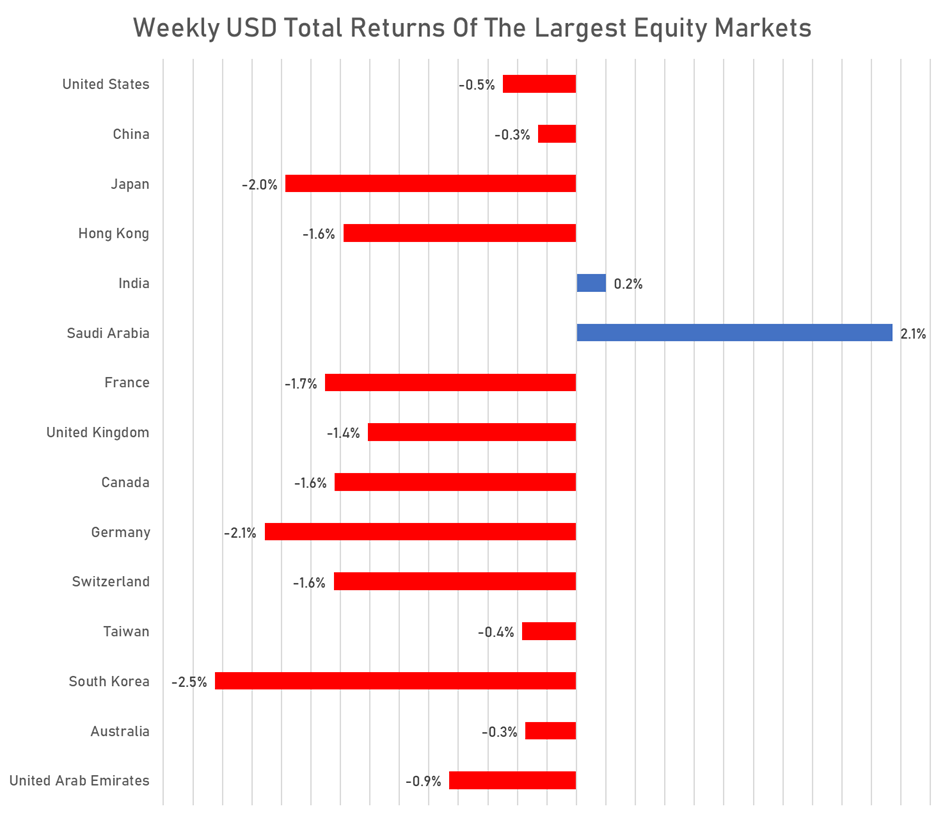
WEEKLY TOTAL RETURNS OF MAJOR GLOBAL EQUITY MARKETS
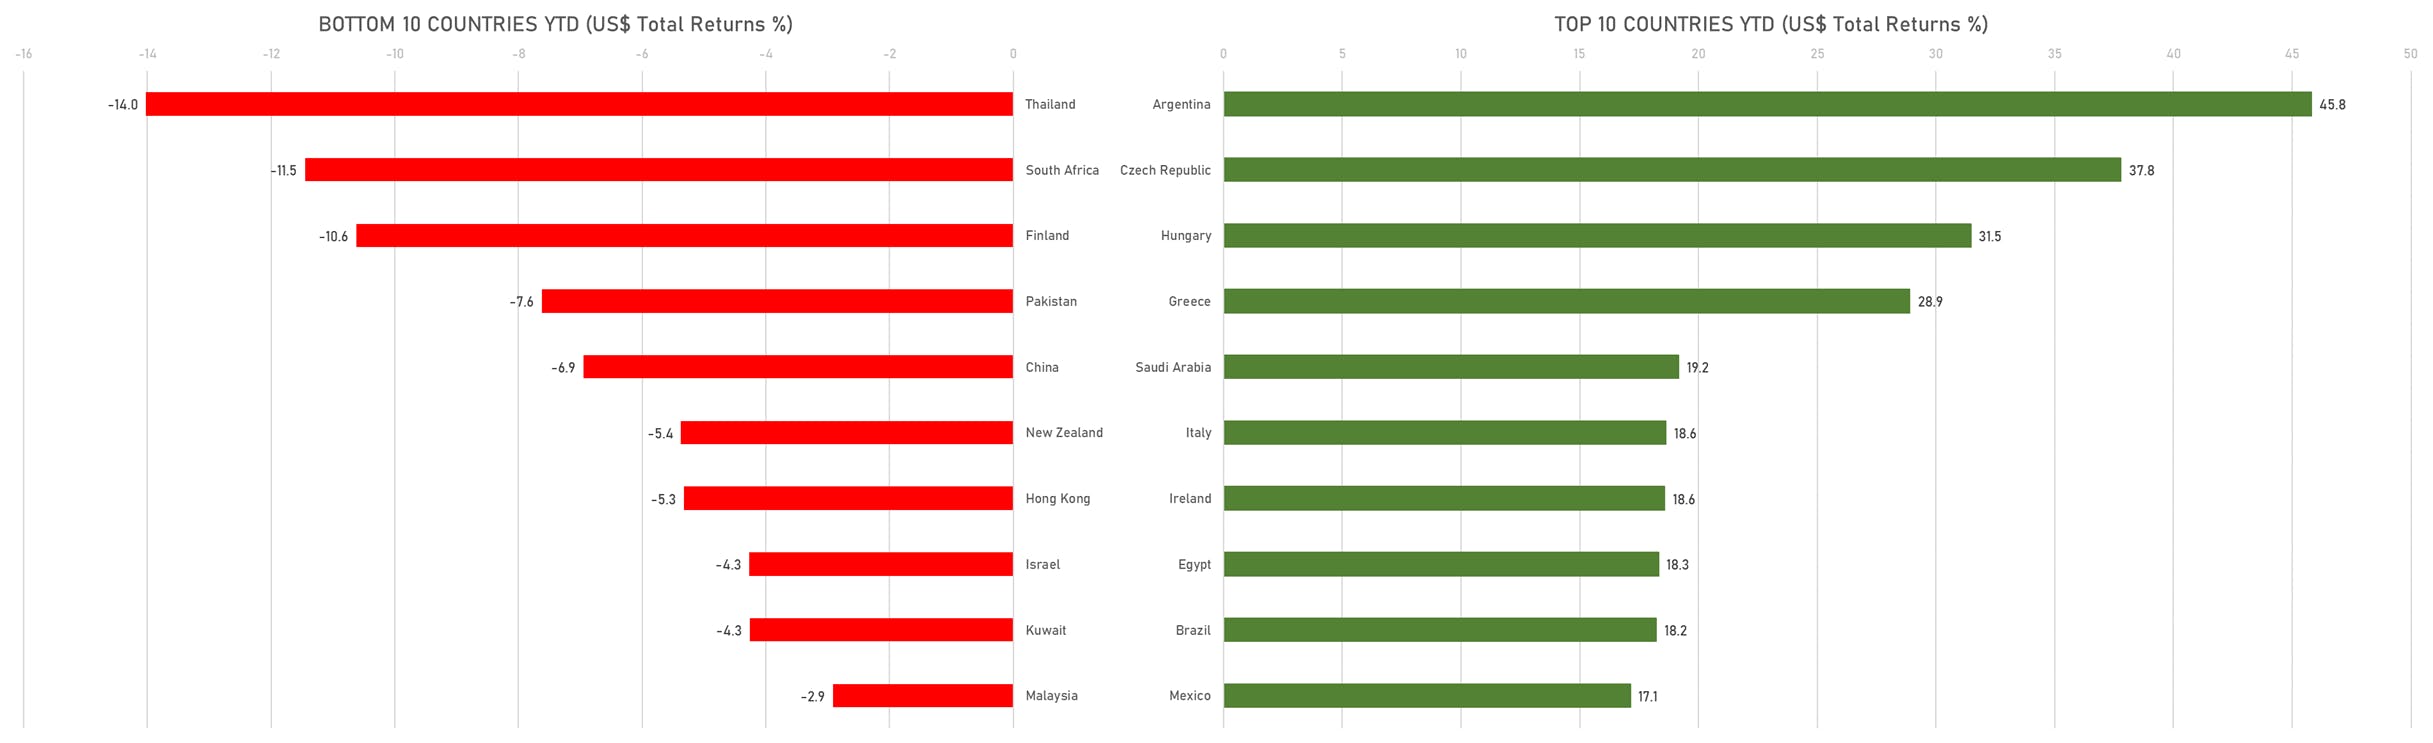
TOP / BOTTOM PERFORMING WORLD MARKETS YTD
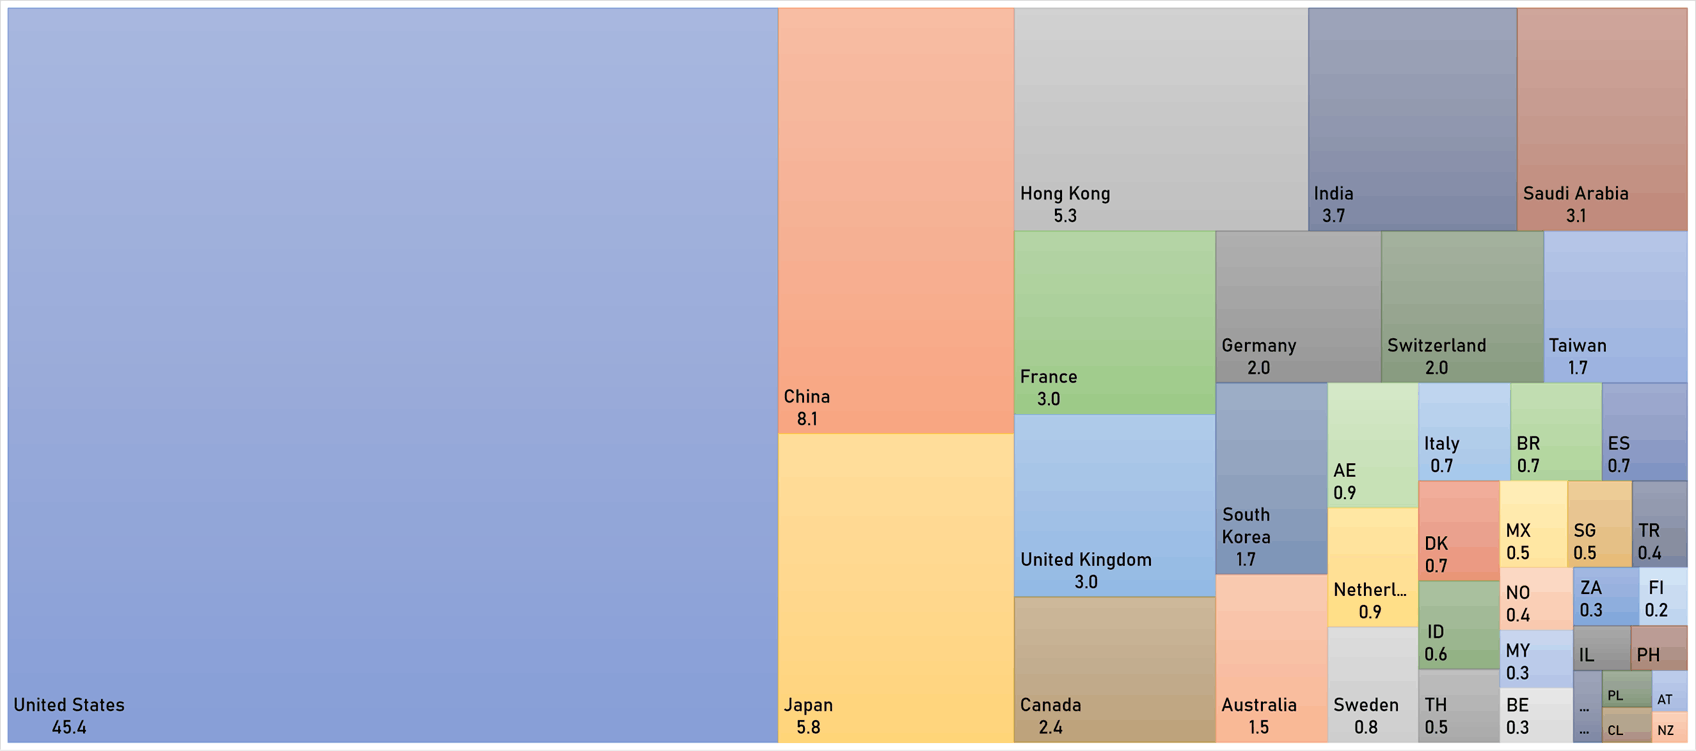
WORLD MARKET CAPITALIZATION (US$ Trillion)