Equities
US Equities End The Week Higher, Pulled Up By The Mega-Cap Technology Stocks
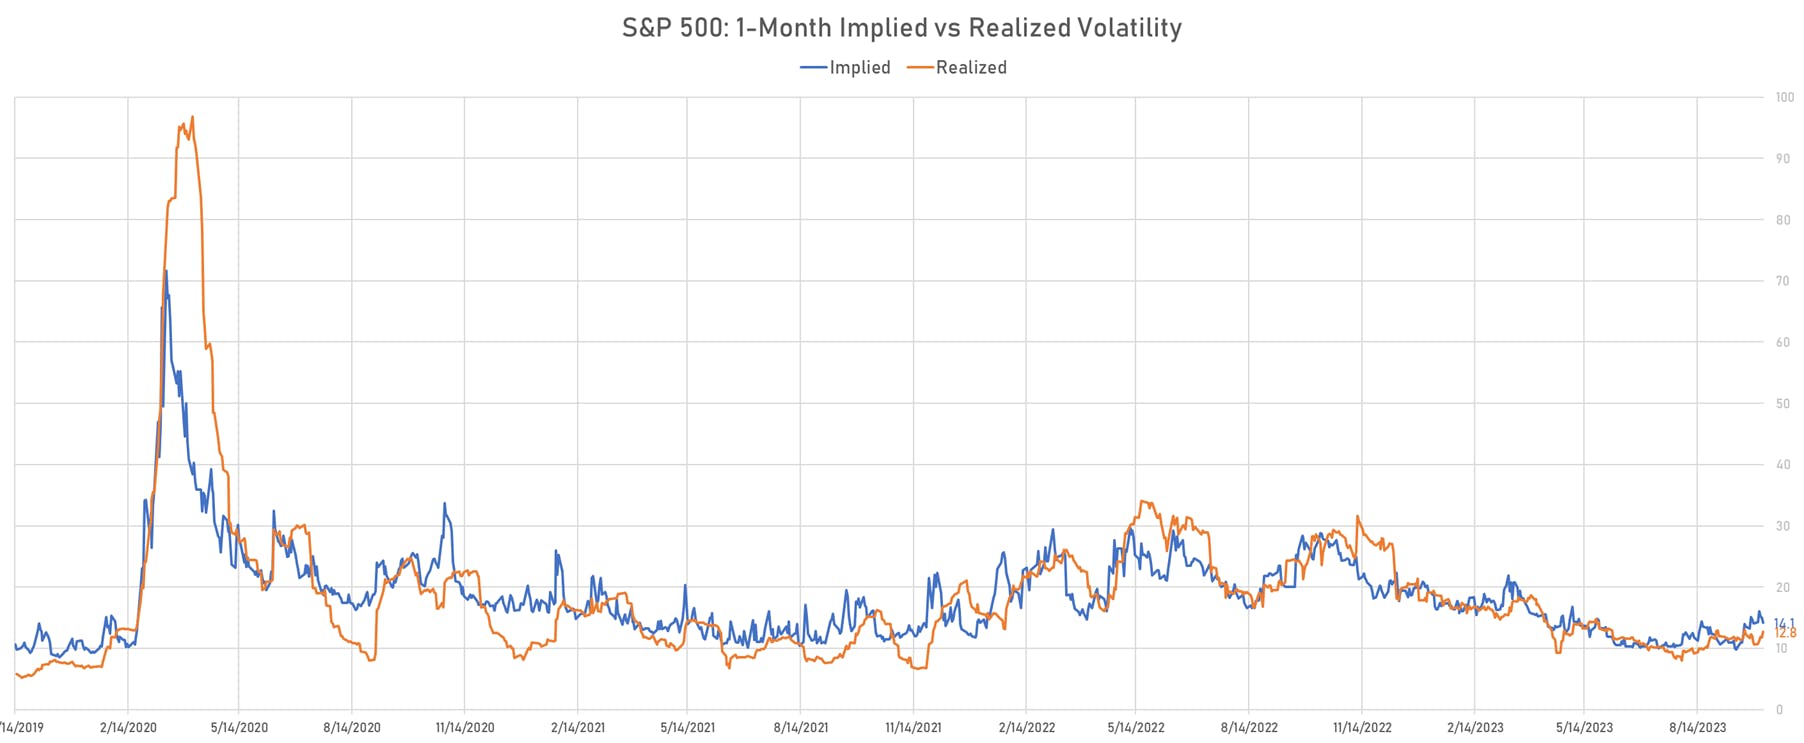
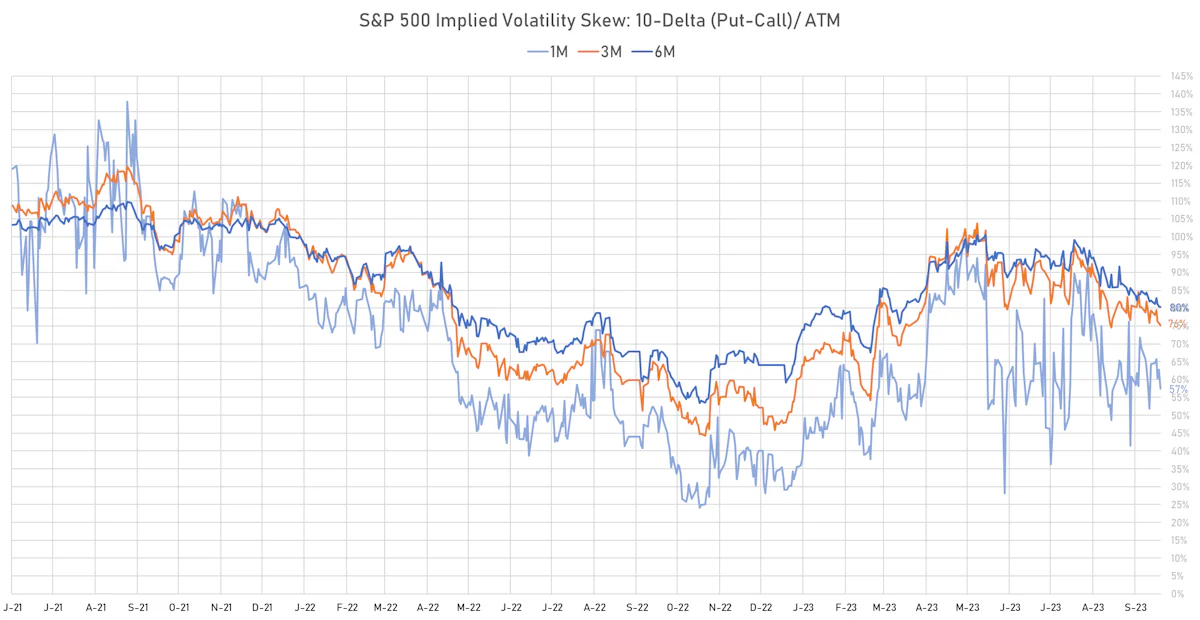
With implied volatility staying at reasonable levels and downside protection not overly bid, it looks like market participants are waiting for a bounce as earnings season is set to kick off
Published ET
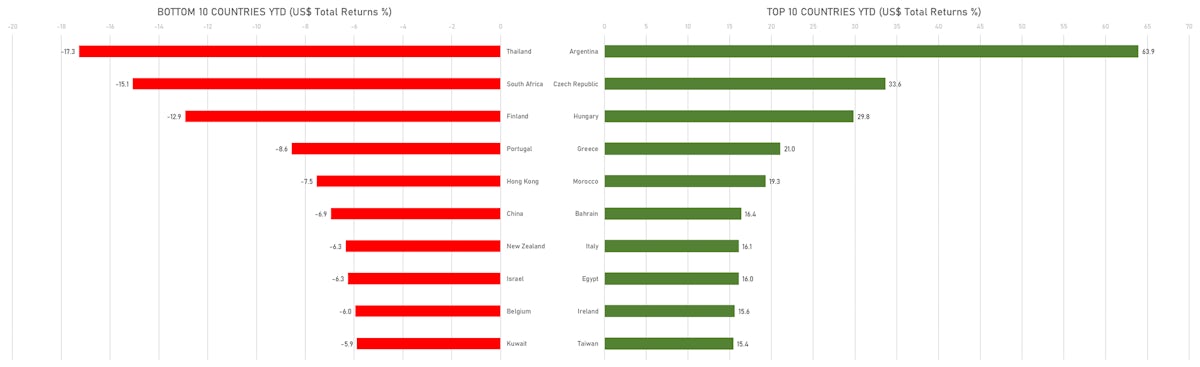
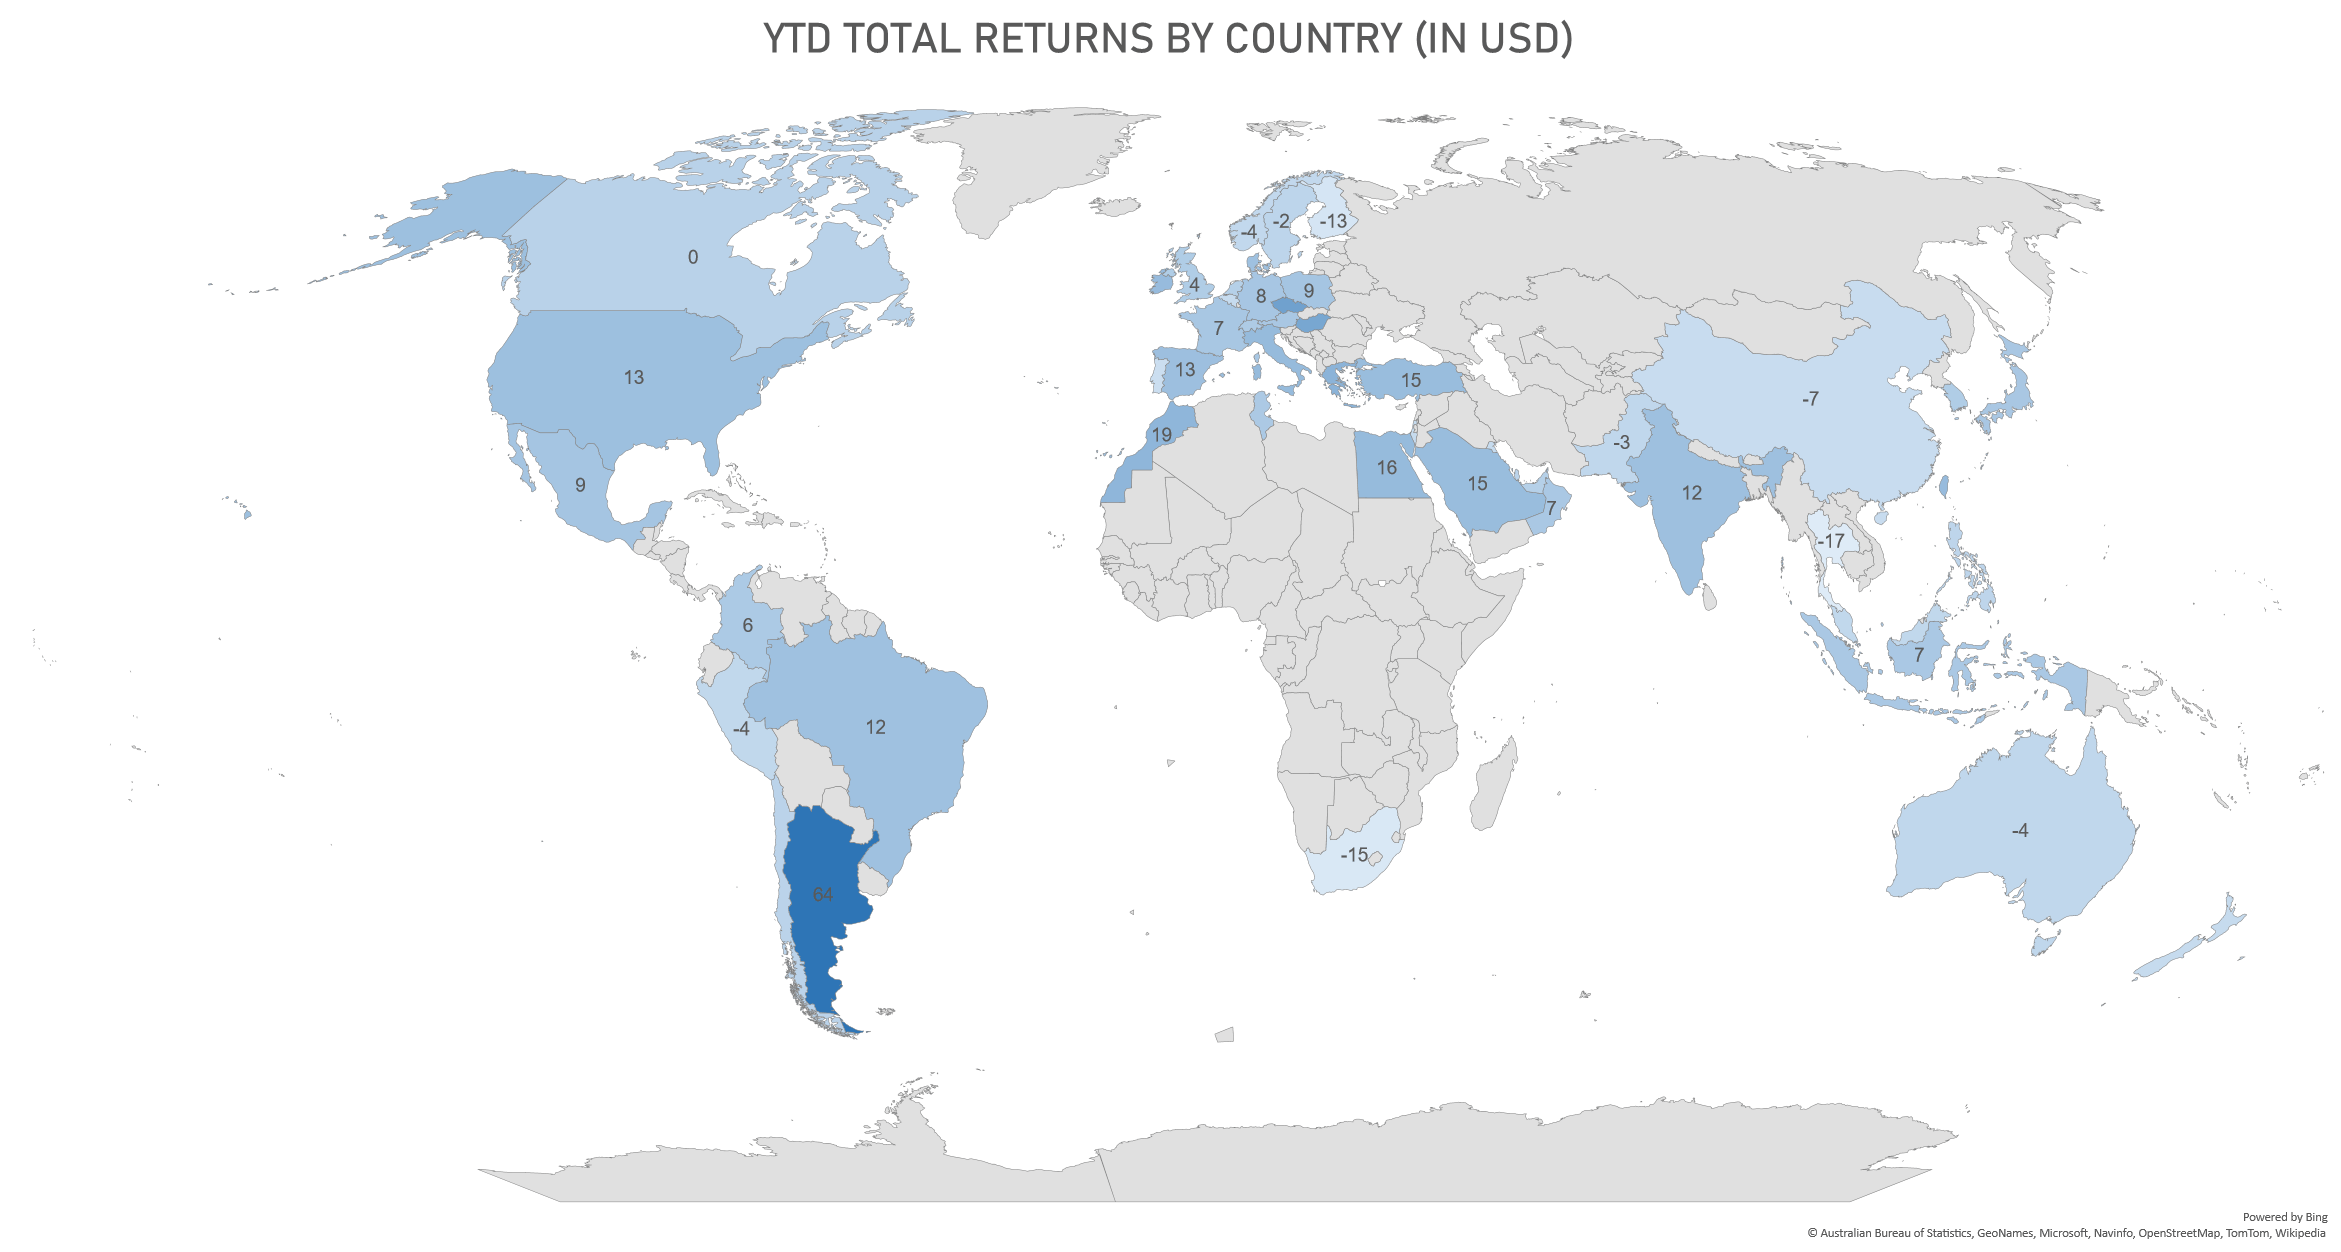
YTD Performance: Top & Bottom countries (US$ total returns) | Sources: phipost.com, FactSet data
DAILY SUMMARY
- Daily performance of US indices: S&P 500 up 1.18%; Nasdaq Composite up 1.60%; Wilshire 5000 up 1.00%
- 79.5% of S&P 500 stocks were up today, with 36.4% of stocks above their 200-day moving average (DMA) and 17.1% above their 50-DMA
- Top performing sectors in the S&P 500: technology up 1.94% and communication services up 1.82%
- Bottom performing sectors in the S&P 500: consumer staples down -0.48% and real estate up 0.34%
- The number of shares in the S&P 500 traded today was 675m for a total turnover of US$ 68 bn
- The S&P 500 Value Index was up 1.1%, while the S&P 500 Growth Index was up 1.3%; the S&P small caps index was up 0.3% and mid-caps were up 0.7%
- The volume on CME's INX (S&P 500 Index) was 2,493.4m (3-month z-score: 0.7); the 3-month average volume is 2,243.1m and the 12-month range is 903.0 - 5,761.3m
- Daily performance of international indices: Europe Stoxx 600 up 0.82%; UK FTSE 100 up 0.58%; Hang Seng SH-SZ-HK 300 Index up 0.59%; Japan's TOPIX 500 down -0.04%
VOLATILITY TODAY
- 3-month at-the-money implied volatility on the S&P 500 at 14.1%, down from 15.0%
- 3-month at-the-money implied volatility on the STOXX Europe 600 at 14.3%, down from 14.6%
TOP WINNERS TODAY
- American Oncology Network Inc (AONC), up 34.0% to $7.93 / YTD price return: -21.1% / 12-Month Price Range: $ 5.91-39.60 / Short interest (% of float): 0.0%; days to cover: 0.5
- ALX Oncology Holdings Inc (ALXO), up 27.4% to $8.35 / YTD price return: -25.9% / 12-Month Price Range: $ 3.94-13.64 / Short interest (% of float): 10.0%; days to cover: 17.0
- Nuscale Power Corp (SMR), up 22.9% to $5.75 / YTD price return: -44.0% / 12-Month Price Range: $ 4.47-12.36 / Short interest (% of float): 17.3%; days to cover: 8.1
- Gritstone bio Inc (GRTS), up 18.3% to $2.85 / YTD price return: -17.4% / 12-Month Price Range: $ 1.14-4.05 / Short interest (% of float): 7.9%; days to cover: 16.7
- TROOPS Inc (TROO), up 15.1% to $4.43 / YTD price return: +102.8% / 12-Month Price Range: $ 1.00-4.99 / Short interest (% of float): 0.3%; days to cover: 11.1
- Terawulf Inc (WULF), up 14.6% to $1.18 / YTD price return: +77.3% / 12-Month Price Range: $ 0.54-4.04 / Short interest (% of float): 17.0%; days to cover: 3.4
- Studio City International Holdings Ltd (MSC), up 14.4% to $5.32 / YTD price return: -10.7% / 12-Month Price Range: $ 1.75-9.57 / Short interest (% of float): 0.0%; days to cover: 4.4
- Oddity Tech Ltd (ODD), up 14.4% to $29.65 / 12-Month Price Range: $ 25.05-56.00 / Short interest (% of float): 11.1%; days to cover: 4.1
- Trivago NV (TRVG), up 13.4% to $1.07 / YTD price return: -20.7% / 12-Month Price Range: $ 0.93-2.03 / Short interest (% of float): 0.4%; days to cover: 0.7
- FingerMotion Inc (FNGR), up 12.2% to $6.45 / YTD price return: +129.5% / 12-Month Price Range: $ 1.01-9.80 / Short interest (% of float): 5.2%; days to cover: 2.0
BIGGEST LOSERS TODAY
- Enviva Inc (EVA), down 16.0% to $5.79 / YTD price return: -89.1% / 12-Month Price Range: $ 5.79-66.68 / Short interest (% of float): 18.0%; days to cover: 8.3 (the stock is currently on the short sale restriction list)
- Cheche Group Inc (CCG), down 15.9% to $7.35 / YTD price return: -28.4% / 12-Month Price Range: $ 7.35-200.00 (the stock is currently on the short sale restriction list)
- Beneficient (BENF), down 11.0% to $1.29 / YTD price return: -87.4% / 12-Month Price Range: $ 1.29-16.50 / Short interest (% of float): 0.1%; days to cover: 0.3 (the stock is currently on the short sale restriction list)
- Sleep Number Corp (SNBR), down 9.6% to $19.08 / YTD price return: -26.6% / 12-Month Price Range: $ 17.50-41.61 / Short interest (% of float): 12.4%; days to cover: 5.3 (the stock is currently on the short sale restriction list)
- Park Aerospace Corp (PKE), down 9.2% to $14.34 / YTD price return: +14.6% / 12-Month Price Range: $ 9.41-16.23 / Short interest (% of float): 1.2%; days to cover: 3.2 (the stock is currently on the short sale restriction list)
- Enliven Therapeutics Inc (ELVN), down 9.0% to $13.12 / YTD price return: -19.8% / 12-Month Price Range: $ 9.00-25.34 / Short interest (% of float): 13.5%; days to cover: 49.6
- ioneer Ltd (IONR), down 8.7% to $4.91 / YTD price return: -54.9% / 12-Month Price Range: $ 4.91-24.00 / Short interest (% of float): 0.0%; days to cover: 1.2 (the stock is currently on the short sale restriction list)
- ThredUp Inc (TDUP), down 8.7% to $3.14 / YTD price return: +139.7% / 12-Month Price Range: $ .73-4.39 / Short interest (% of float): 10.1%; days to cover: 9.8
- Rackspace Technology Inc (RXT), down 8.5% to $1.61 / YTD price return: -45.4% / 12-Month Price Range: $ 1.05-6.07 / Short interest (% of float): 2.9%; days to cover: 3.3
- Vera Therapeutics Inc (VERA), down 8.1% to $12.38 / YTD price return: -36.0% / 12-Month Price Range: $ 5.20-21.02 / Short interest (% of float): 9.0%; days to cover: 7.6
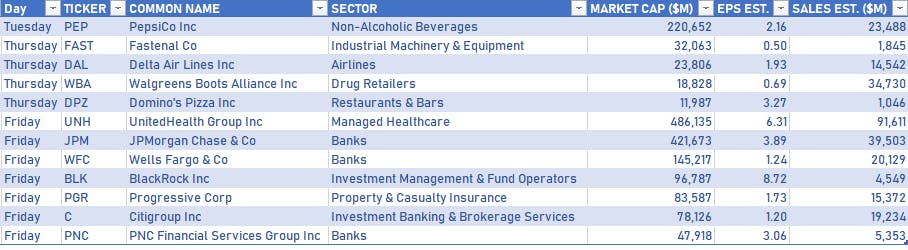
NOTABLE US EARNINGS RELEASES IN THE WEEK AHEAD
TOP S&P 500 PERFORMERS THIS WEEK
- Marketaxess Holdings Inc (MKTX), up 11.7% to $238.73 / YTD price return: -14.4% / 12-Month Price Range: $ 200.60-398.91 / Short interest (% of float): 5.1%; days to cover: 4.4
- Edwards Lifesciences Corp (EW), up 6.4% to $73.70 / YTD price return: -1.2% / 12-Month Price Range: $ 67.14-94.87 / Short interest (% of float): 2.1%; days to cover: 3.8
- CME Group Inc (CME), up 5.8% to $211.93 / YTD price return: +26.0% / 12-Month Price Range: $ 162.26-211.93 / Short interest (% of float): 1.0%; days to cover: 2.7
- Arista Networks Inc (ANET), up 5.5% to $194.02 / YTD price return: +59.9% / 12-Month Price Range: $ 98.81-198.51 / Short interest (% of float): 1.4%; days to cover: 1.7
- EQT Corp (EQT), up 5.4% to $42.79 / YTD price return: +26.5% / 12-Month Price Range: $ 28.11-45.91 / Short interest (% of float): 6.5%; days to cover: 5.1
- Martin Marietta Materials Inc (MLM), up 5.4% to $432.70 / YTD price return: +28.0% / 12-Month Price Range: $ 298.42-462.91 / Short interest (% of float): 0.9%; days to cover: 1.5
- Everest Group Ltd (EG), up 5.4% to $391.78 / YTD price return: +18.3% / 12-Month Price Range: $ 256.75-394.63 / Short interest (% of float): 1.0%; days to cover: 1.8
- Live Nation Entertainment Inc (LYV), up 5.4% to $87.51 / YTD price return: +25.5% / 12-Month Price Range: $ 64.25-101.73 / Short interest (% of float): 8.2%; days to cover: 7.3
- Eli Lilly and Co (LLY), up 5.2% to $565.22 / YTD price return: +54.5% / 12-Month Price Range: $ 302.14-601.76 / Short interest (% of float): 0.7%; days to cover: 1.9
- Palo Alto Networks Inc (PANW), up 5.2% to $246.69 / YTD price return: +76.8% / 12-Month Price Range: $ 132.28-258.87 / Short interest (% of float): 6.9%; days to cover: 4.4
BOTTOM S&P 500 PERFORMERS THIS WEEK
- AES Corp (AES), down 18.1% to $12.45 / YTD price return: -56.7% / 12-Month Price Range: $ 12.37-29.87 / Short interest (% of float): 2.0%; days to cover: 2.1
- McCormick & Company Inc (MKC), down 14.7% to $64.55 / YTD price return: -22.1% / 12-Month Price Range: $ 64.55-94.39 / Short interest (% of float): 2.6%; days to cover: 6.6
- Nextera Energy Inc (NEE), down 12.3% to $50.24 / YTD price return: -39.9% / 12-Month Price Range: $ 48.24-88.61 / Short interest (% of float): 0.9%; days to cover: 2.1
- Hasbro Inc (HAS), down 11.2% to $58.76 / YTD price return: -3.7% / 12-Month Price Range: $ 45.75-73.56 / Short interest (% of float): 6.7%; days to cover: 5.0
- Dexcom Inc (DXCM), down 10.8% to $83.22 / YTD price return: -26.5% / 12-Month Price Range: $ 80.80-139.51 / Short interest (% of float): 4.2%; days to cover: 3.7
- Valero Energy Corp (VLO), down 10.7% to $126.53 / YTD price return: -.3% / 12-Month Price Range: $ 104.18-152.13 / Short interest (% of float): 2.8%
- Boston Properties Inc (BXP), down 10.5% to $53.23 / YTD price return: -21.2% / 12-Month Price Range: $ 46.19-79.36 / Short interest (% of float): 5.2%; days to cover: 6.2
- Domino's Pizza Inc (DPZ), down 9.8% to $341.56 / YTD price return: -1.4% / 12-Month Price Range: $ 285.90-409.48 / Short interest (% of float): 4.8%; days to cover: 3.8
- Kellanova (K), down 9.7% to $50.43 / YTD price return: -24.6% / 12-Month Price Range: $ 50.43-72.40 / Short interest (% of float): 2.7%; days to cover: 3.4
- Phillips 66 (PSX), down 9.1% to $109.19 / YTD price return: +4.9% / 12-Month Price Range: $ 88.64-125.16 / Short interest (% of float): 2.2%
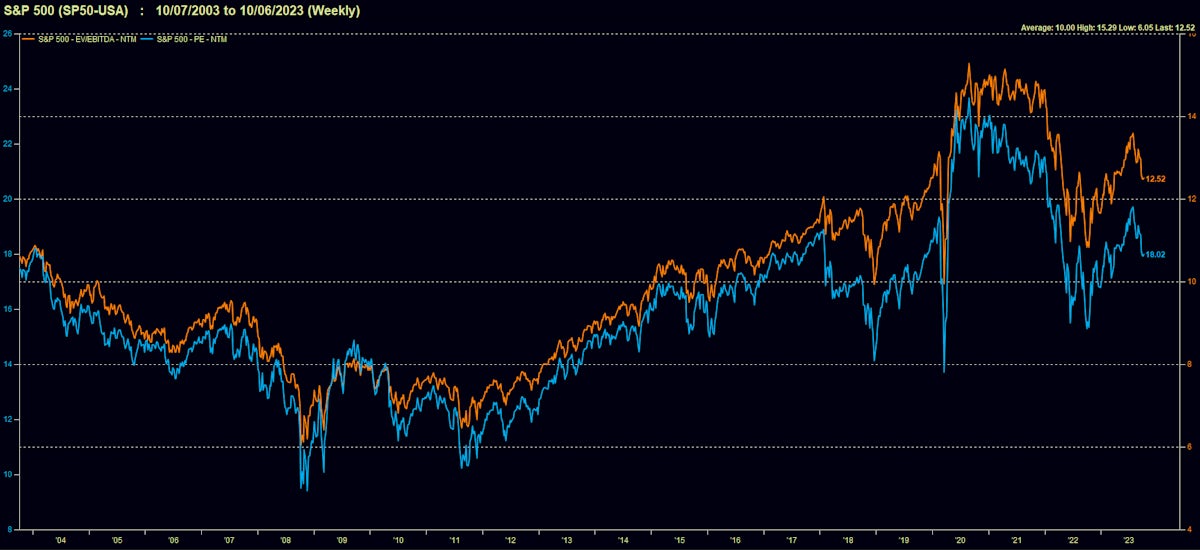
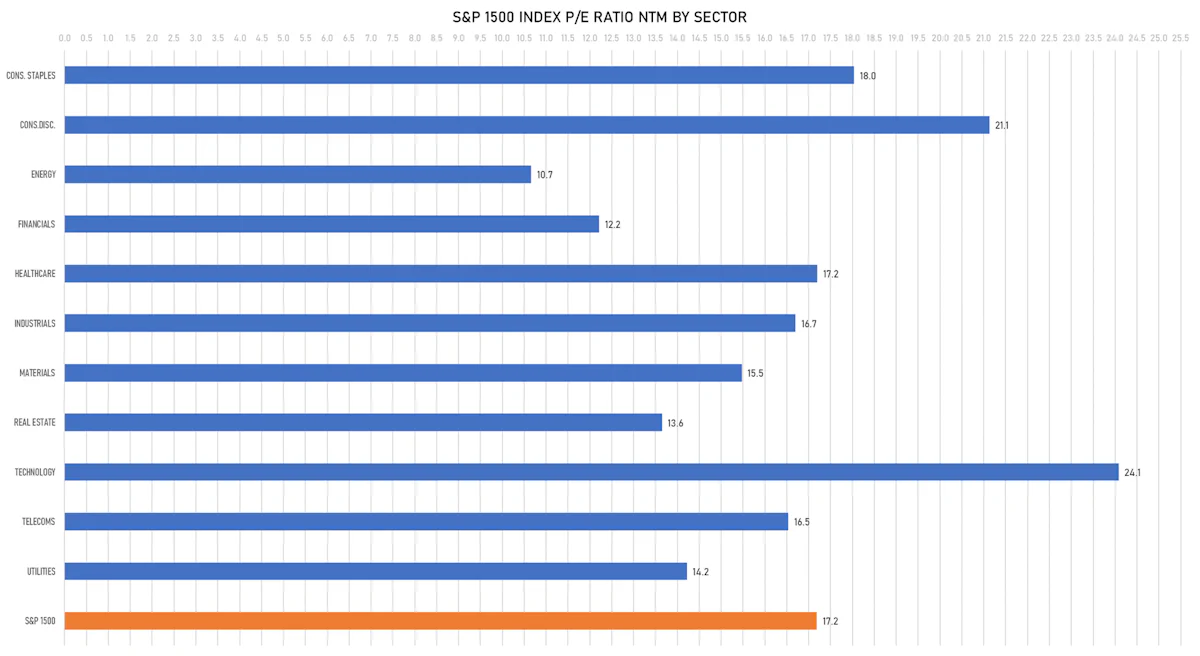
VALUATION MULTIPLES BY SECTORS
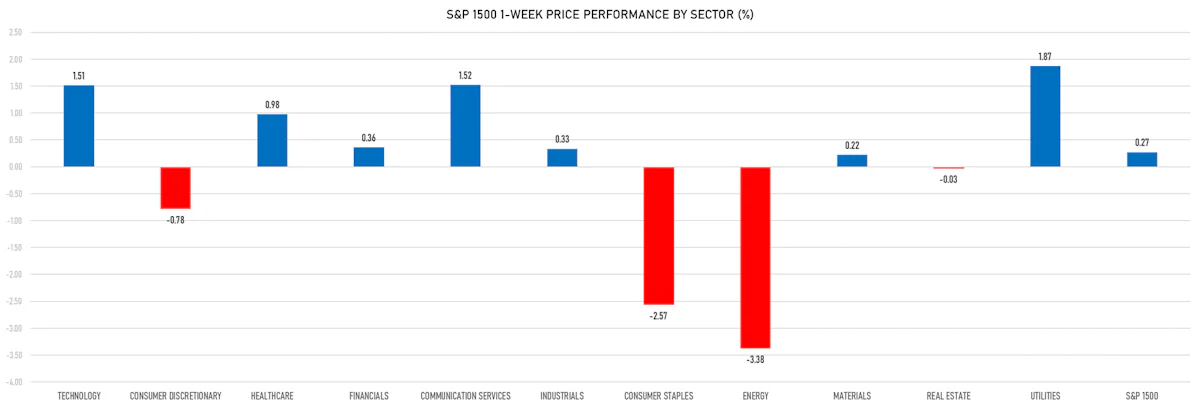
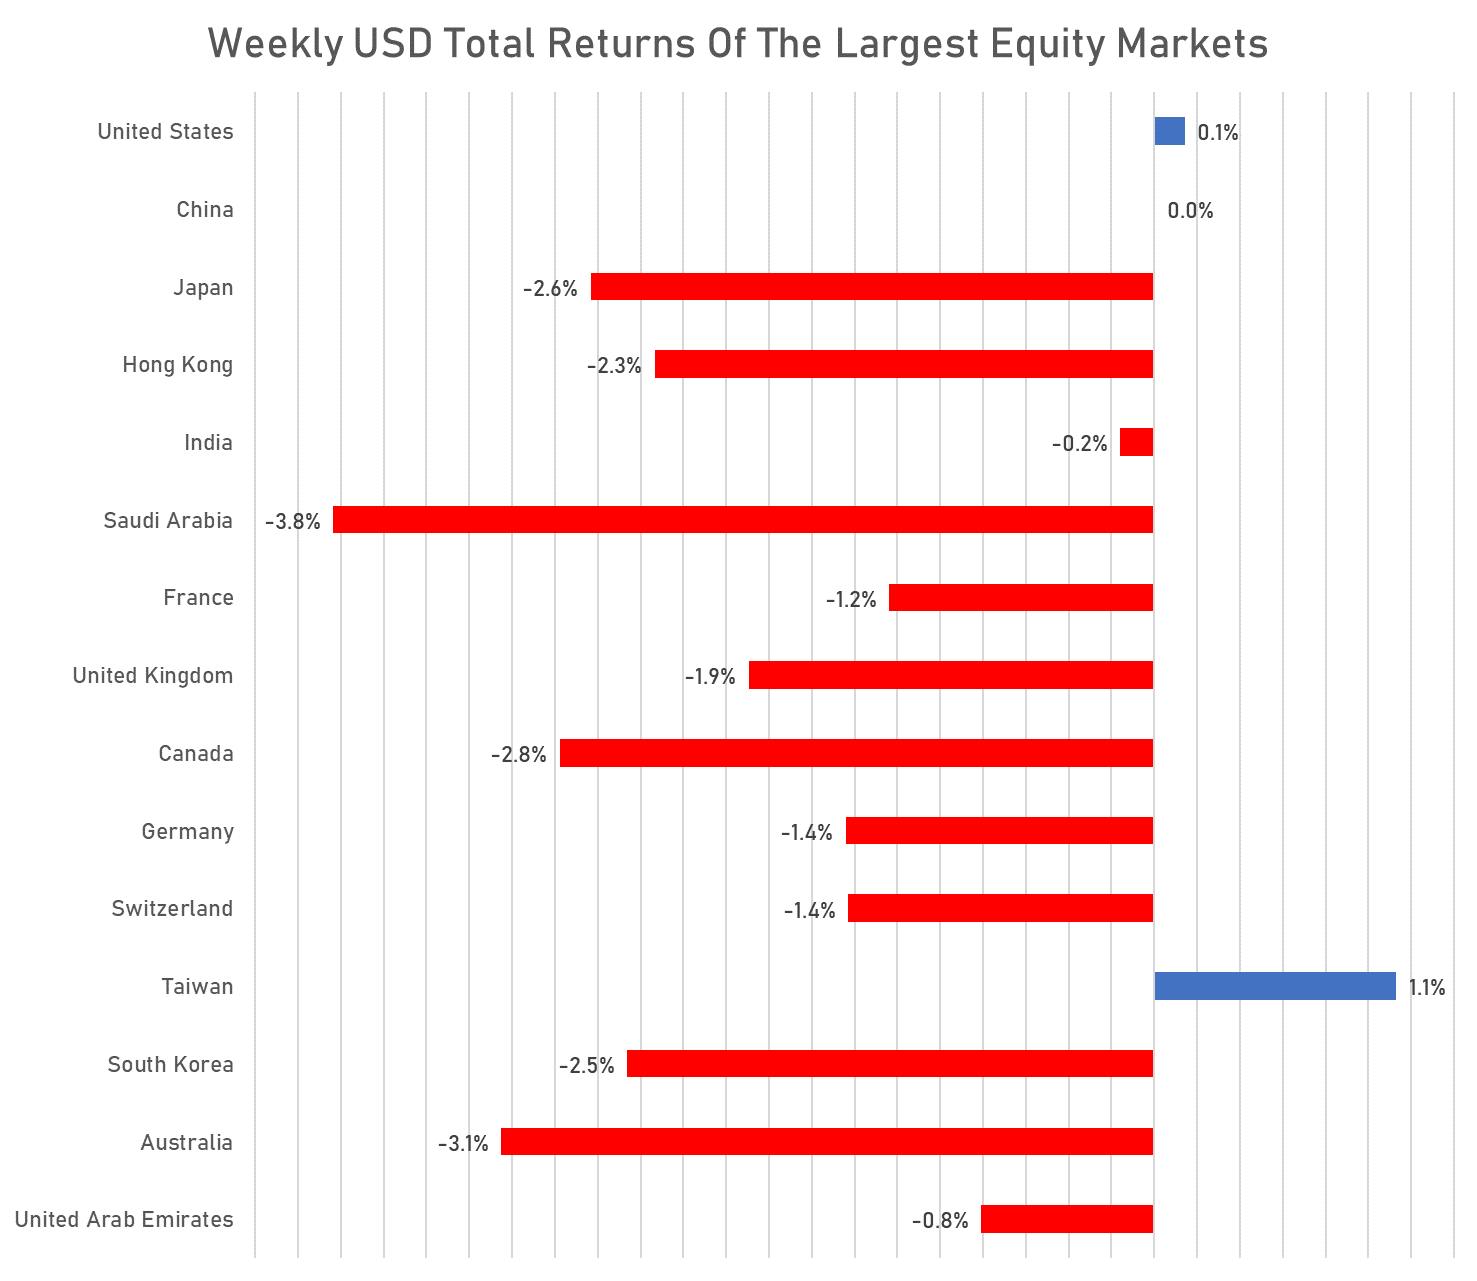
WEEKLY US$ TOTAL RETURNS OF MAJOR GLOBAL EQUITY MARKETS
WORLD MARKETS YTD (US$ TR)
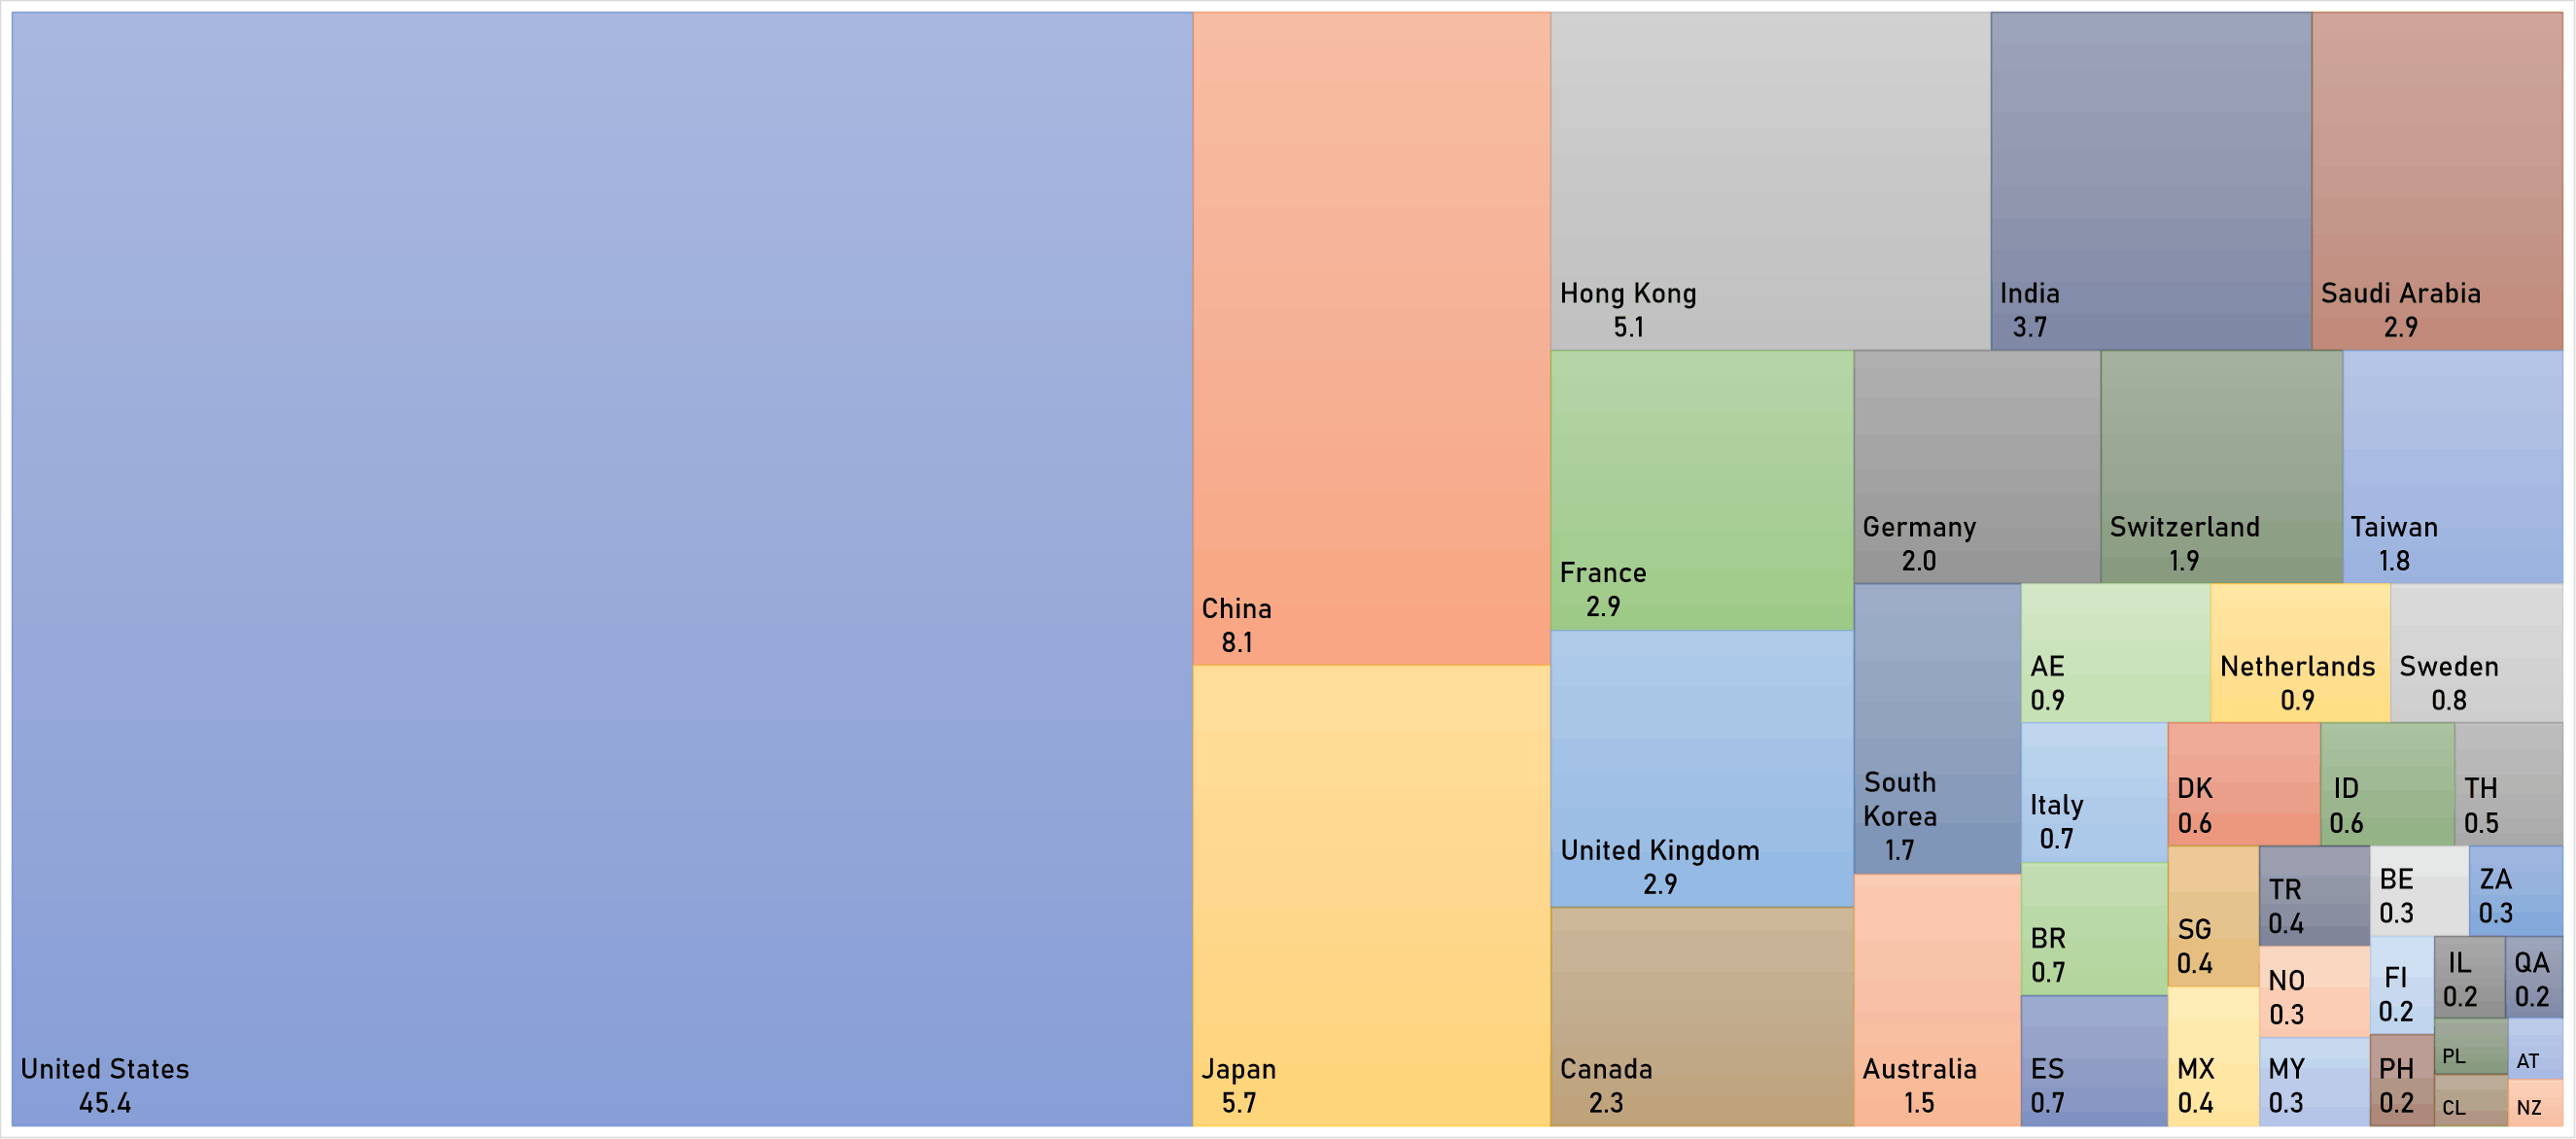
WORLD MARKET CAPITALIZATION (US$ Trillion)