Equities
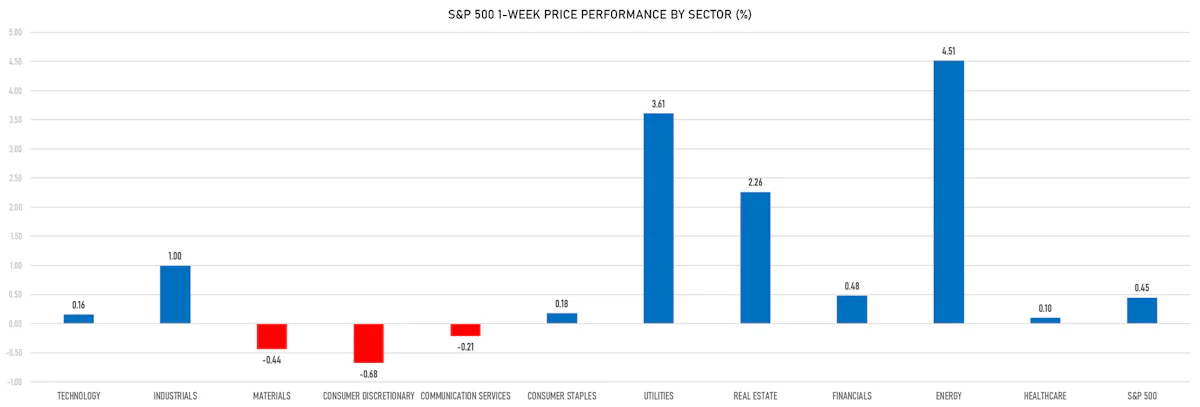
Energy And Defense Stocks Outperformed This Week As War Looms In The Middle East
Low bar to clear for corporates as 3Q23 earnings start rolling in; upside seen on the revenue side, with profit margins contracting for the 5th consecutive quarter
Published ET
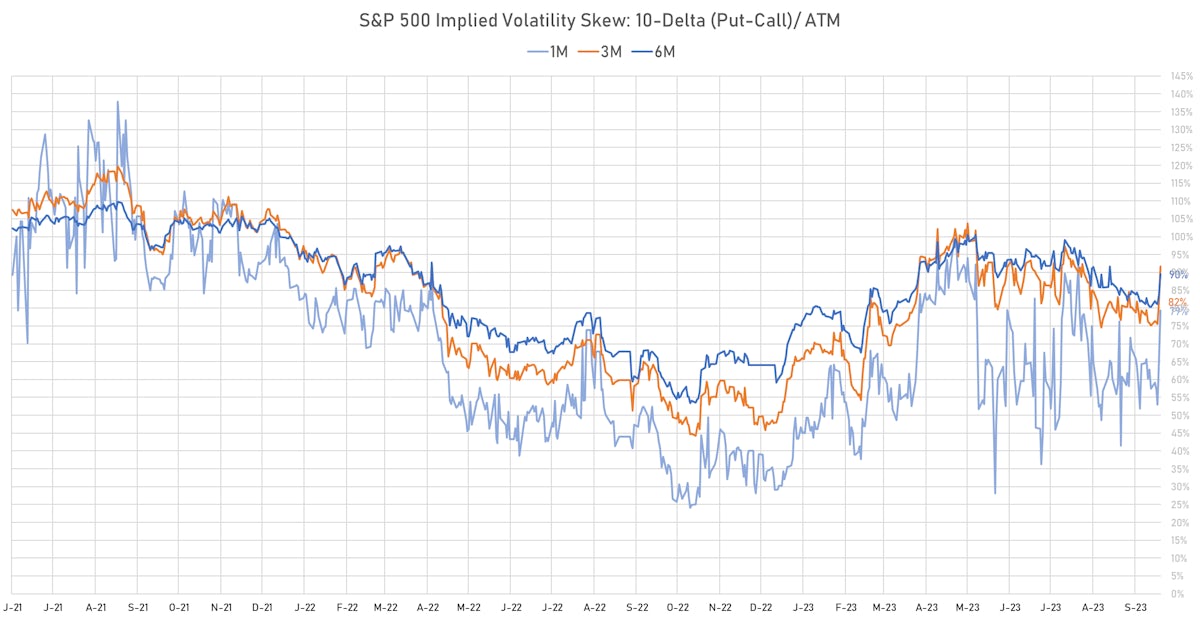
S&P 500 10-Delta Implied Volatility Skew | Sources: phipost.com, Refinitiv data
DAILY SUMMARY
- Daily performance of US indices: S&P 500 down -0.50%; Nasdaq Composite down -1.23%; Wilshire 5000 down -0.80%
- 43.5% of S&P 500 stocks were up today, with 38.0% of stocks above their 200-day moving average (DMA) and 25.4% above their 50-DMA
- Top performing sectors in the S&P 500: energy up 2.25% and utilities up 1.09%
- Bottom performing sectors in the S&P 500: technology down -1.52% and consumer discretionary down -1.46%
- The number of shares in the S&P 500 traded today was 625m for a total turnover of US$ 65 bn
- The S&P 500 Value Index was down -0.5%, while the S&P 500 Growth Index was down -0.5%; the S&P small caps index was down -1.2% and mid-caps were down -0.8%
- The volume on CME's INX (S&P 500 Index) was 2,302.7m (3-month z-score: 0.2); the 3-month average volume is 2,237.8m and the 12-month range is 903.0 - 5,761.3m
- Daily performance of international indices: Europe Stoxx 600 down -0.98%; UK FTSE 100 down -0.59%; Hang Seng SH-SZ-HK 300 Index down -1.81%; Japan's TOPIX 500 down -1.41%
VOLATILITY TODAY
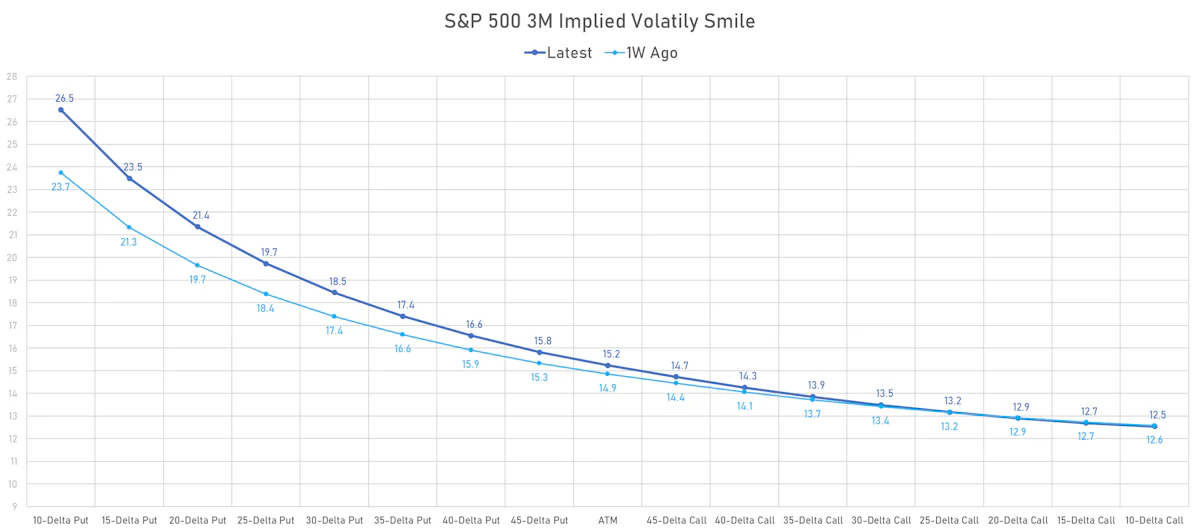
- 3-month at-the-money implied volatility on the S&P 500 at 14.8%, up from 13.2%
- 3-month at-the-money implied volatility on the STOXX Europe 600 at 14.4%, up from 12.5%
TOP WINNERS TODAY
- Comtech Telecommunications Corp (CMTL), up 27.4% to $10.37 / YTD price return: -14.6% / 12-Month Price Range: $ 7.91-16.87 / Short interest (% of float): 1.0%; days to cover: 1.9
- Sunopta Inc (STKL), up 24.1% to $3.55 / YTD price return: -57.9% / 12-Month Price Range: $ 2.79-11.67 / Short interest (% of float): 6.0%; days to cover: 7.7
- Revolution Medicines Inc (RVMD), up 23.6% to $29.91 / YTD price return: +25.6% / 12-Month Price Range: $ 17.47-35.50 / Short interest (% of float): 10.1%; days to cover: 9.1
- Golden Heaven Group Holdings Ltd (GDHG), up 22.0% to $13.34 / 12-Month Price Range: $ 2.94-13.34 / Short interest (% of float): 0.5%; days to cover: 0.5
- Cheche Group Inc (CCG), up 18.7% to $6.72 / YTD price return: -34.5% / 12-Month Price Range: $ 5.50-200.00 / Short interest (% of float): 0.5%; days to cover: 0.1
- EHang Holdings Ltd (EH), up 18.7% to $20.30 / YTD price return: +136.6% / 12-Month Price Range: $ 3.32-23.24 / Short interest (% of float): 21.5%; days to cover: 16.8
- Groupon Inc (GRPN), up 16.2% to $12.71 / YTD price return: +47.9% / 12-Month Price Range: $ 2.89-16.25 / Short interest (% of float): 20.7%; days to cover: 4.3
- Lexicon Pharmaceuticals Inc (LXRX), up 14.4% to $1.19 / YTD price return: -37.7% / 12-Month Price Range: $ 0.96-3.79 / Short interest (% of float): 8.3%; days to cover: 12.5
- Hecla Mining Co (HL), up 13.1% to $4.14 / YTD price return: -25.5% / 12-Month Price Range: $ 3.55-7.00
- Coeur Mining Inc (CDE), up 11.6% to $2.50 / YTD price return: -25.6% / 12-Month Price Range: $ 2.02-4.55 / Short interest (% of float): 8.1%; days to cover: 4.2
BIGGEST LOSERS TODAY
- T2 Biosystems Inc (TTOO), down 52.9% to $8.20 / YTD price return: -94.2% / 12-Month Price Range: $ 5.40-386.00
- Bridgetown Holdings Ltd (MNY), down 45.5% to $3.35 / YTD price return: -66.2% / 12-Month Price Range: $ 3.35-10.43
- SMART Global Holdings Inc. (SGH), down 44.4% to $13.10 / YTD price return: -12.1% / 12-Month Price Range: $ 12.04-29.99 / Short interest (% of float): 7.6%; days to cover: 6.9 (the stock is currently on the short sale restriction list)
- MSP Recovery Inc (LIFW), down 33.7% to $2.17 / YTD price return: -94.6% / 12-Month Price Range: $ 1.08-43.50
- Harmony Biosciences Holdings Inc (HRMY), down 30.2% to $21.11 / YTD price return: -61.7% / 12-Month Price Range: $ 21.11-62.09 / Short interest (% of float): 19.9%; days to cover: 10.7 (the stock is currently on the short sale restriction list)
- Belden Inc (BDC), down 25.5% to $71.02 / YTD price return: -1.2% / 12-Month Price Range: $ 58.53-99.13 / Short interest (% of float): 2.5%; days to cover: 4.6 (the stock is currently on the short sale restriction list)
- ATRenew Inc (RERE), down 24.5% to $1.60 / YTD price return: -44.6% / 12-Month Price Range: $ 1.52-3.51 / Short interest (% of float): 0.2%; days to cover: 1.3 (the stock is currently on the short sale restriction list)
- Bitdeer Technologies Group (BTDR), down 20.2% to $4.50 / 12-Month Price Range: $ 4.50-14.75 / Short interest (% of float): 0.9%; days to cover: 1.8 (the stock is currently on the short sale restriction list)
- Cassava Sciences Inc (SAVA), down 15.3% to $14.86 / YTD price return: -49.7% / 12-Month Price Range: $ 14.86-45.43 / Short interest (% of float): 36.1%; days to cover: 16.3 (the stock is currently on the short sale restriction list)
- Ribbon Communications Inc (RBBN), down 14.5% to $2.07 / YTD price return: -25.8% / 12-Month Price Range: $ 2.07-4.84 / Short interest (% of float): 2.2%; days to cover: 8.7 (the stock is currently on the short sale restriction list)
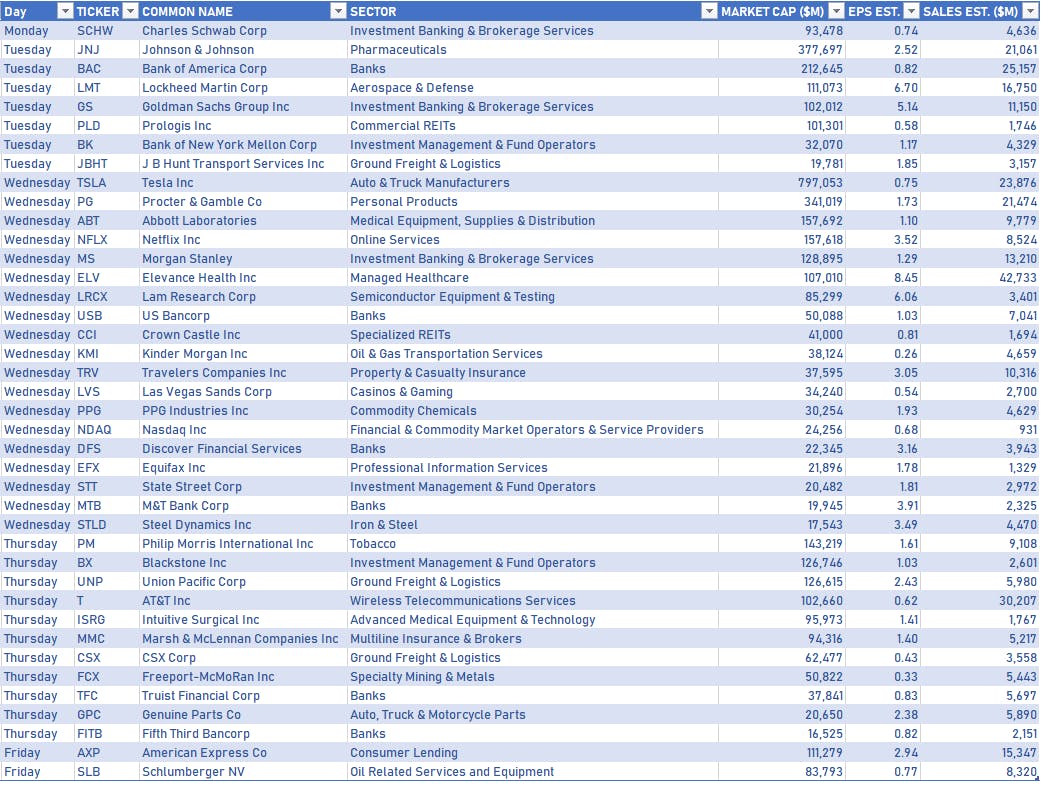
NOTABLE US EARNINGS RELEASES IN THE WEEK AHEAD
S&P 500 EARNINGS SCORECARD 3Q23
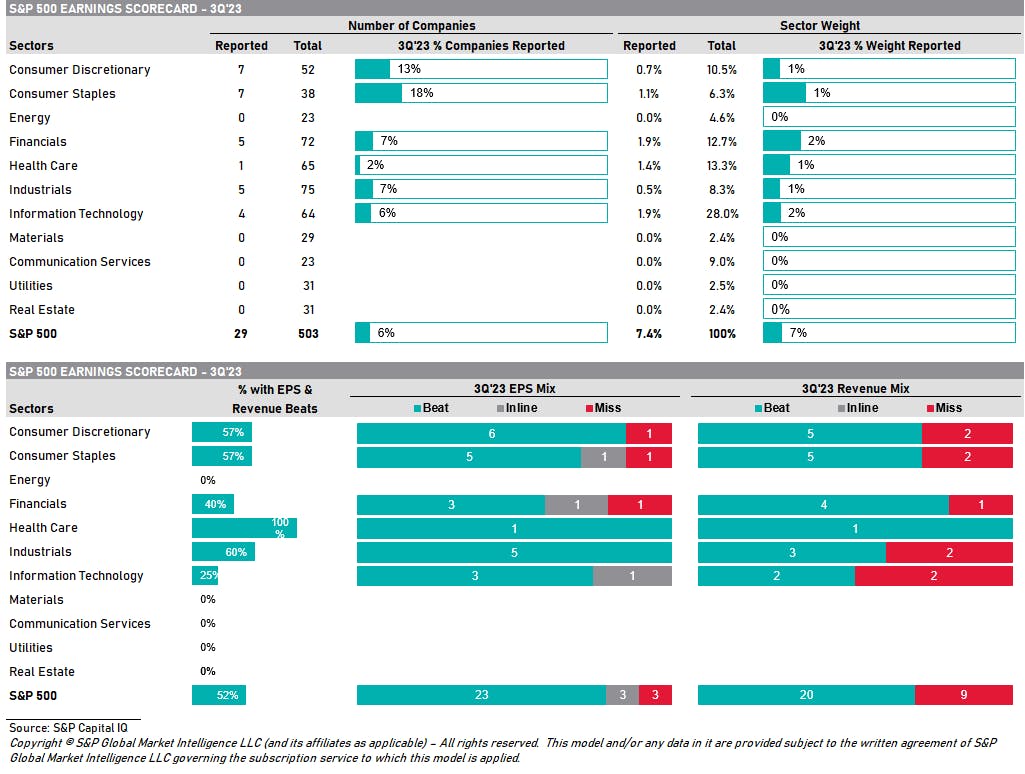
Source: S&P CapitalIQ
TOP S&P 500 PERFORMERS THIS WEEK
- Northrop Grumman Corp (NOC), up 15.8% to $490.15 / YTD price return: -10.2% / 12-Month Price Range: $ 414.74-556.17 / Short interest (% of float): 0.9%; days to cover: 2.1
- Marathon Oil Corp (MRO), up 14.2% to $28.07 / YTD price return: +3.7% / 12-Month Price Range: $ 20.57-33.42
- EOG Resources Inc (EOG), up 10.9% to $133.84 / YTD price return: +4.3% / 12-Month Price Range: $ 99.11-147.74
- Devon Energy Corp (DVN), up 10.7% to $48.39 / YTD price return: -21.3% / 12-Month Price Range: $ 42.59-78.81 / Short interest (% of float): 1.5%; days to cover: 1.2
- Hess Corp (HES), up 10.5% to $160.98 / YTD price return: +13.5% / 12-Month Price Range: $ 113.91-165.42
- General Dynamics Corp (GD), up 10.5% to $243.04 / YTD price return: -2.0% / 12-Month Price Range: $ 202.64-256.86 / Short interest (% of float): 0.8%; days to cover: 2.4
- Diamondback Energy Inc (FANG), up 10.1% to $166.57 / YTD price return: +21.8% / 12-Month Price Range: $ 119.19-168.95
- Lockheed Martin Corp (LMT), up 10.1% to $441.06 / YTD price return: -9.3% / 12-Month Price Range: $ 388.20-508.02 / Short interest (% of float): 0.8%; days to cover: 1.8
- APA Corp (US) (APA), up 9.7% to $41.25 / YTD price return: -11.6% / 12-Month Price Range: $ 30.67-50.58 / Short interest (% of float): 2.4%; days to cover: 2.0
- Halliburton Co (HAL), up 9.7% to $42.43 / YTD price return: +7.8% / 12-Month Price Range: $ 27.84-43.42 / Short interest (% of float): 2.2%; days to cover: 3.0
BOTTOM S&P 500 PERFORMERS THIS WEEK
- DaVita Inc (DVA), down 18.3% to $73.20 / YTD price return: -2.0% / 12-Month Price Range: $ 65.28-116.70 / Short interest (% of float): 4.0%; days to cover: 5.0
- Hormel Foods Corp (HRL), down 13.2% to $32.02 / YTD price return: -29.7% / 12-Month Price Range: $ 32.02-49.70 (the stock is currently on the short sale restriction list)
- Baxter International Inc (BAX), down 13.1% to $31.84 / YTD price return: -37.5% / 12-Month Price Range: $ 31.64-58.11
- Lamb Weston Holdings Inc (LW), down 11.0% to $83.18 / YTD price return: -6.9% / 12-Month Price Range: $ 79.45-115.99 / Short interest (% of float): 2.4%; days to cover: 2.4
- Norwegian Cruise Line Holdings Ltd (NCLH), down 10.8% to $14.86 / YTD price return: +21.4% / 12-Month Price Range: $ 11.77-22.68 / Short interest (% of float): 10.3%; days to cover: 3.9
- Insulet Corp (PODD), down 9.0% to $132.38 / YTD price return: -55.0% / 12-Month Price Range: $ 125.82-335.84 / Short interest (% of float): 5.1%; days to cover: 2.5
- Dexcom Inc (DXCM), down 8.4% to $76.19 / YTD price return: -32.7% / 12-Month Price Range: $ 75.08-139.51 / Short interest (% of float): 4.1%; days to cover: 3.4
- American Airlines Group Inc (AAL), down 8.2% to $11.72 / YTD price return: -7.9% / 12-Month Price Range: $ 11.72-19.08 / Short interest (% of float): 11.9%; days to cover: 3.1
- Veralto Corp (VLTO), down 7.9% to $71.85 / YTD price return: .0% / 12-Month Price Range: $ 71.85-88.99
- Delta Air Lines Inc (DAL), down 7.8% to $34.10 / YTD price return: +3.8% / 12-Month Price Range: $ 28.52-49.80 / Short interest (% of float): 2.6%; days to cover: 2.3
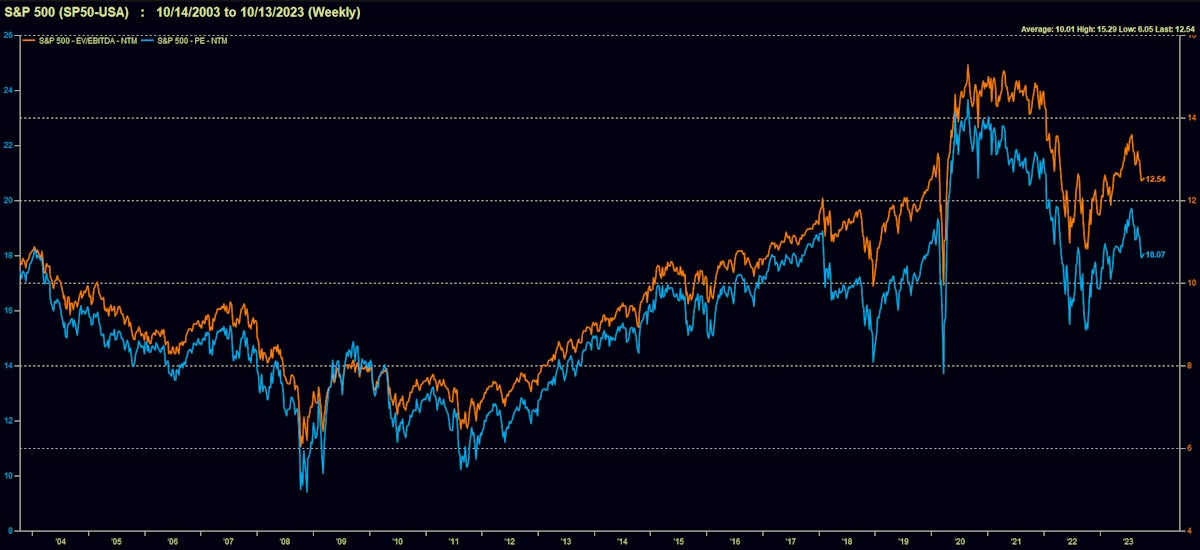
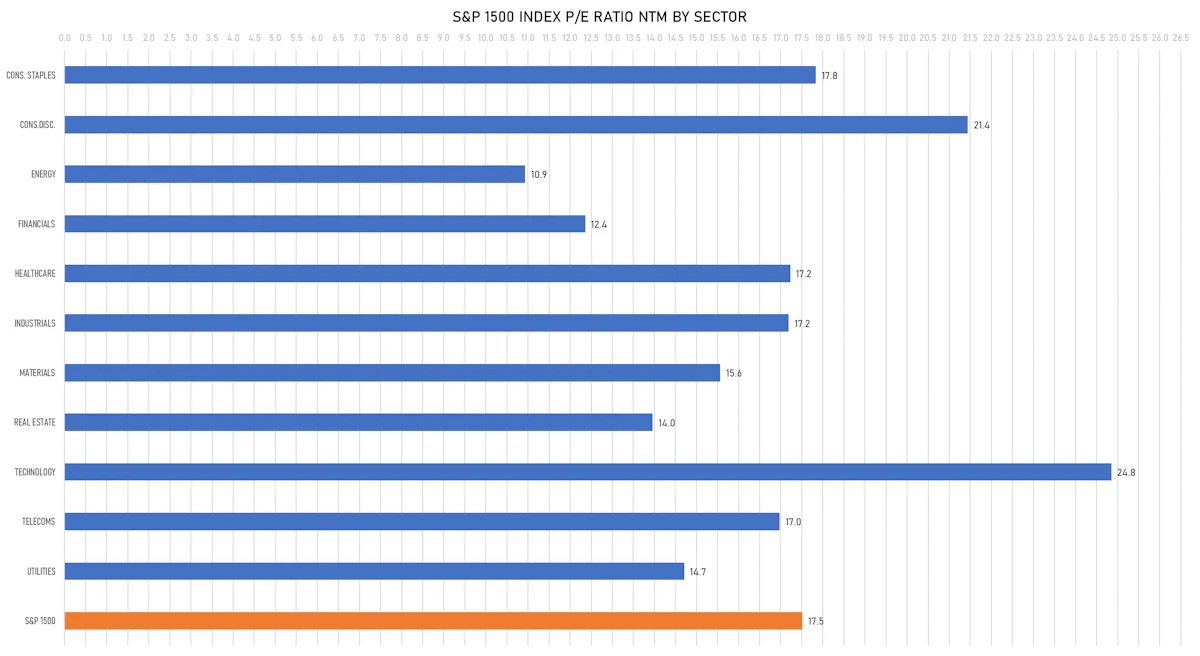
VALUATION MULTIPLES BY SECTORS
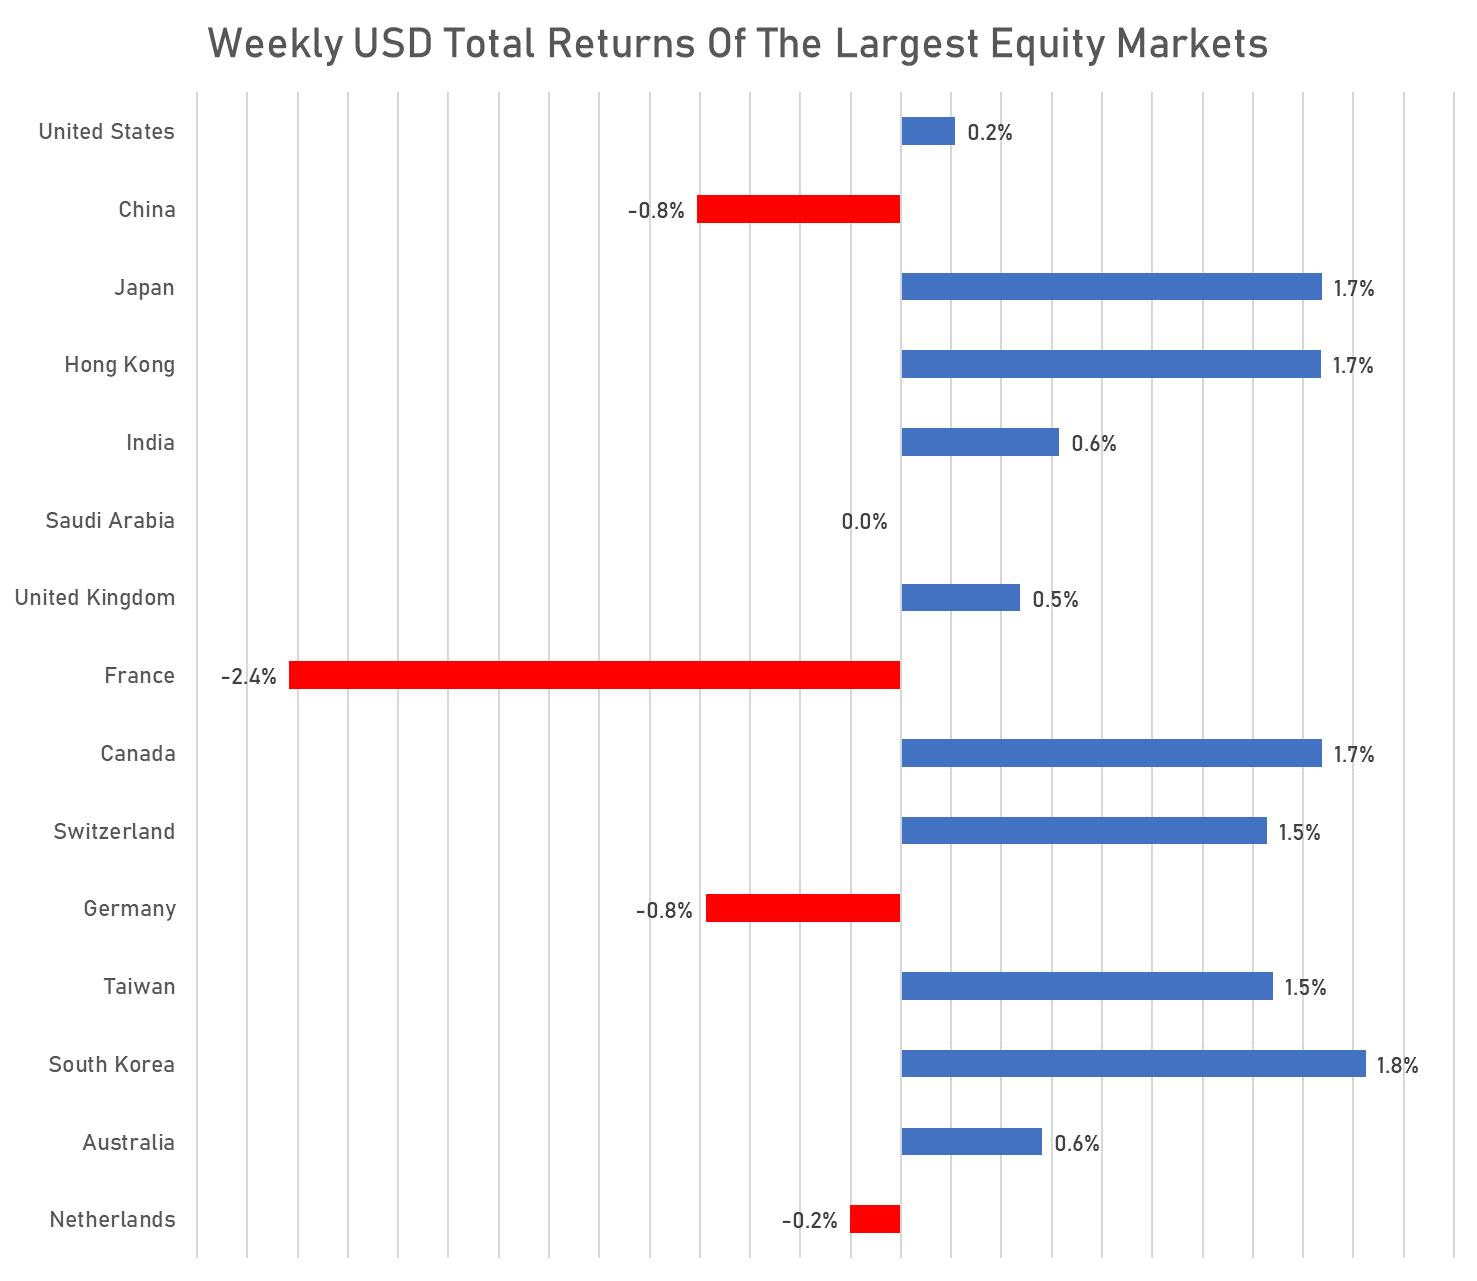
WEEKLY TOTAL RETURNS OF MAJOR GLOBAL EQUITY MARKETS
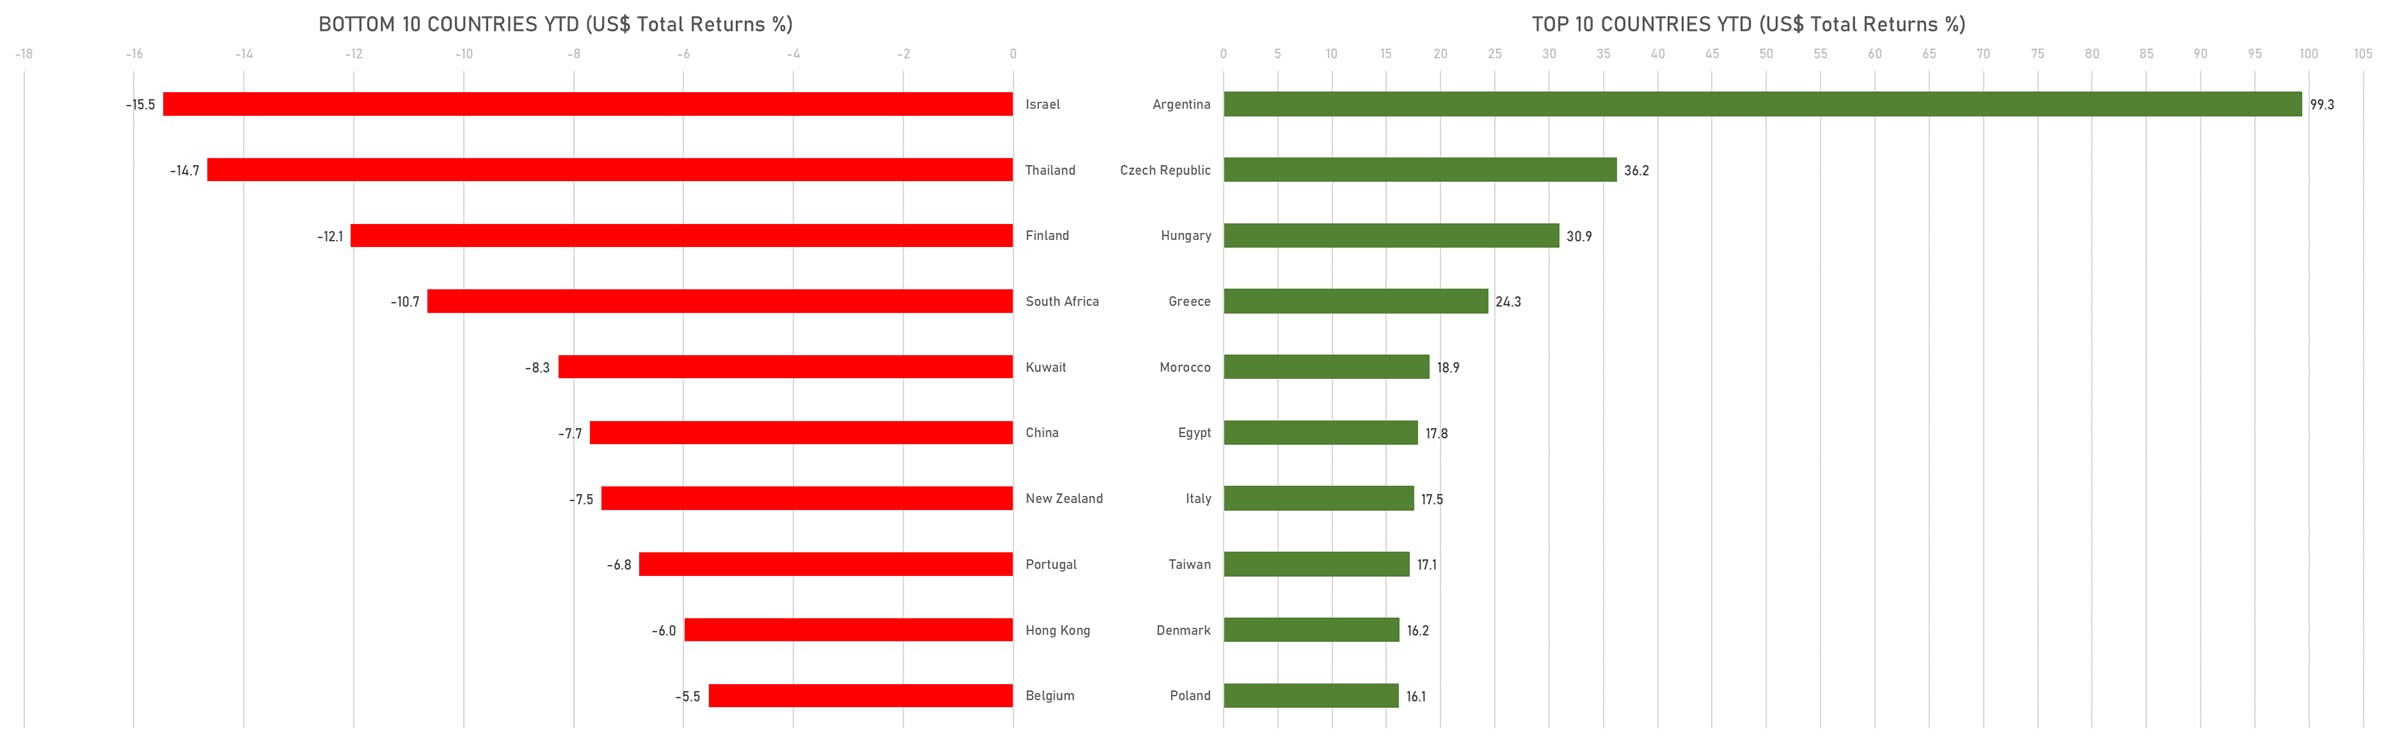
TOP / BOTTOM PERFORMING WORLD MARKETS YTD
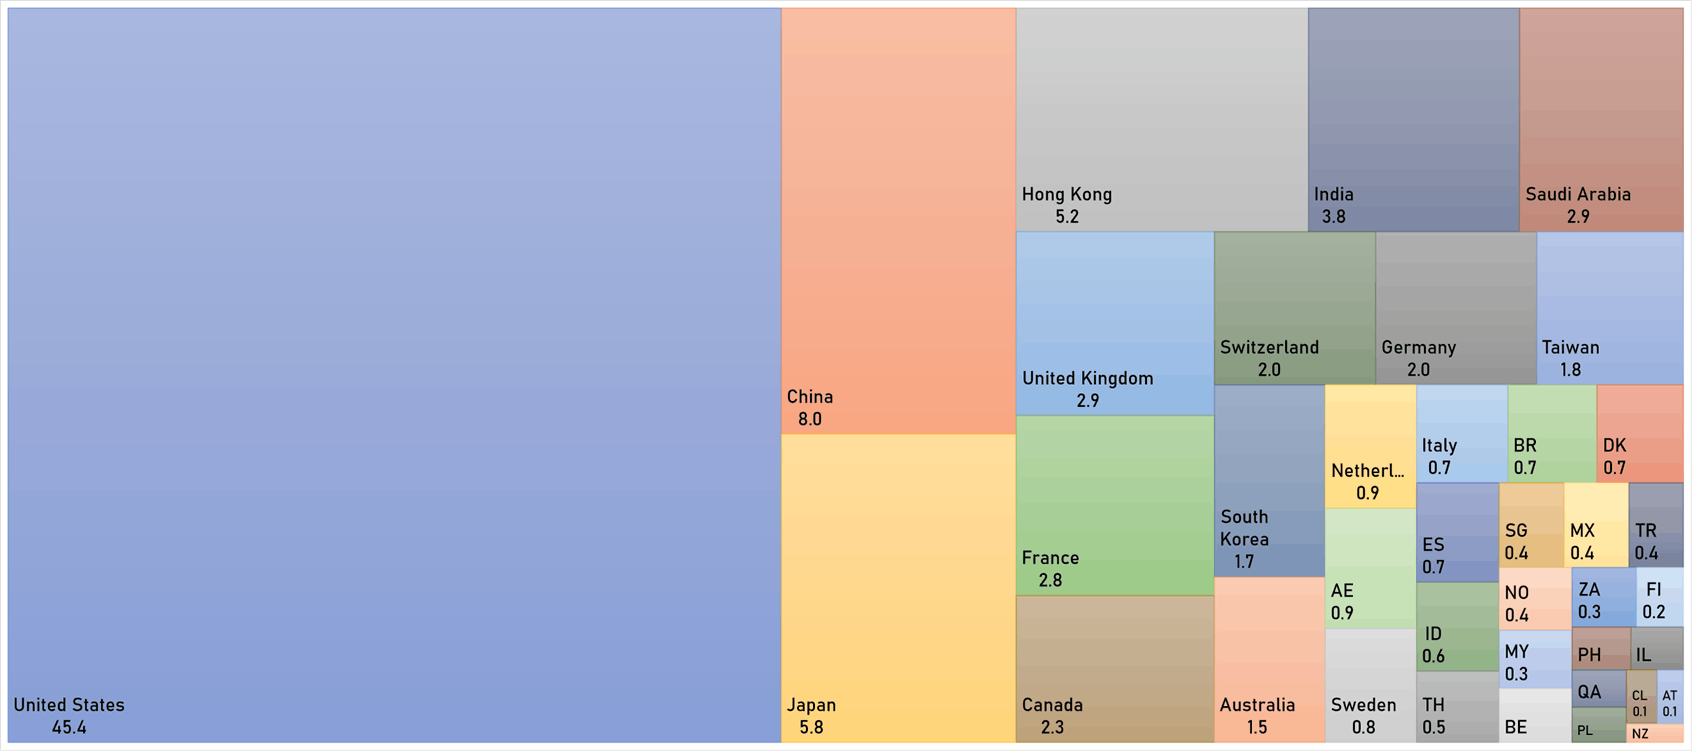
WORLD MARKET CAPITALIZATION (US$ Trillion)