Equities
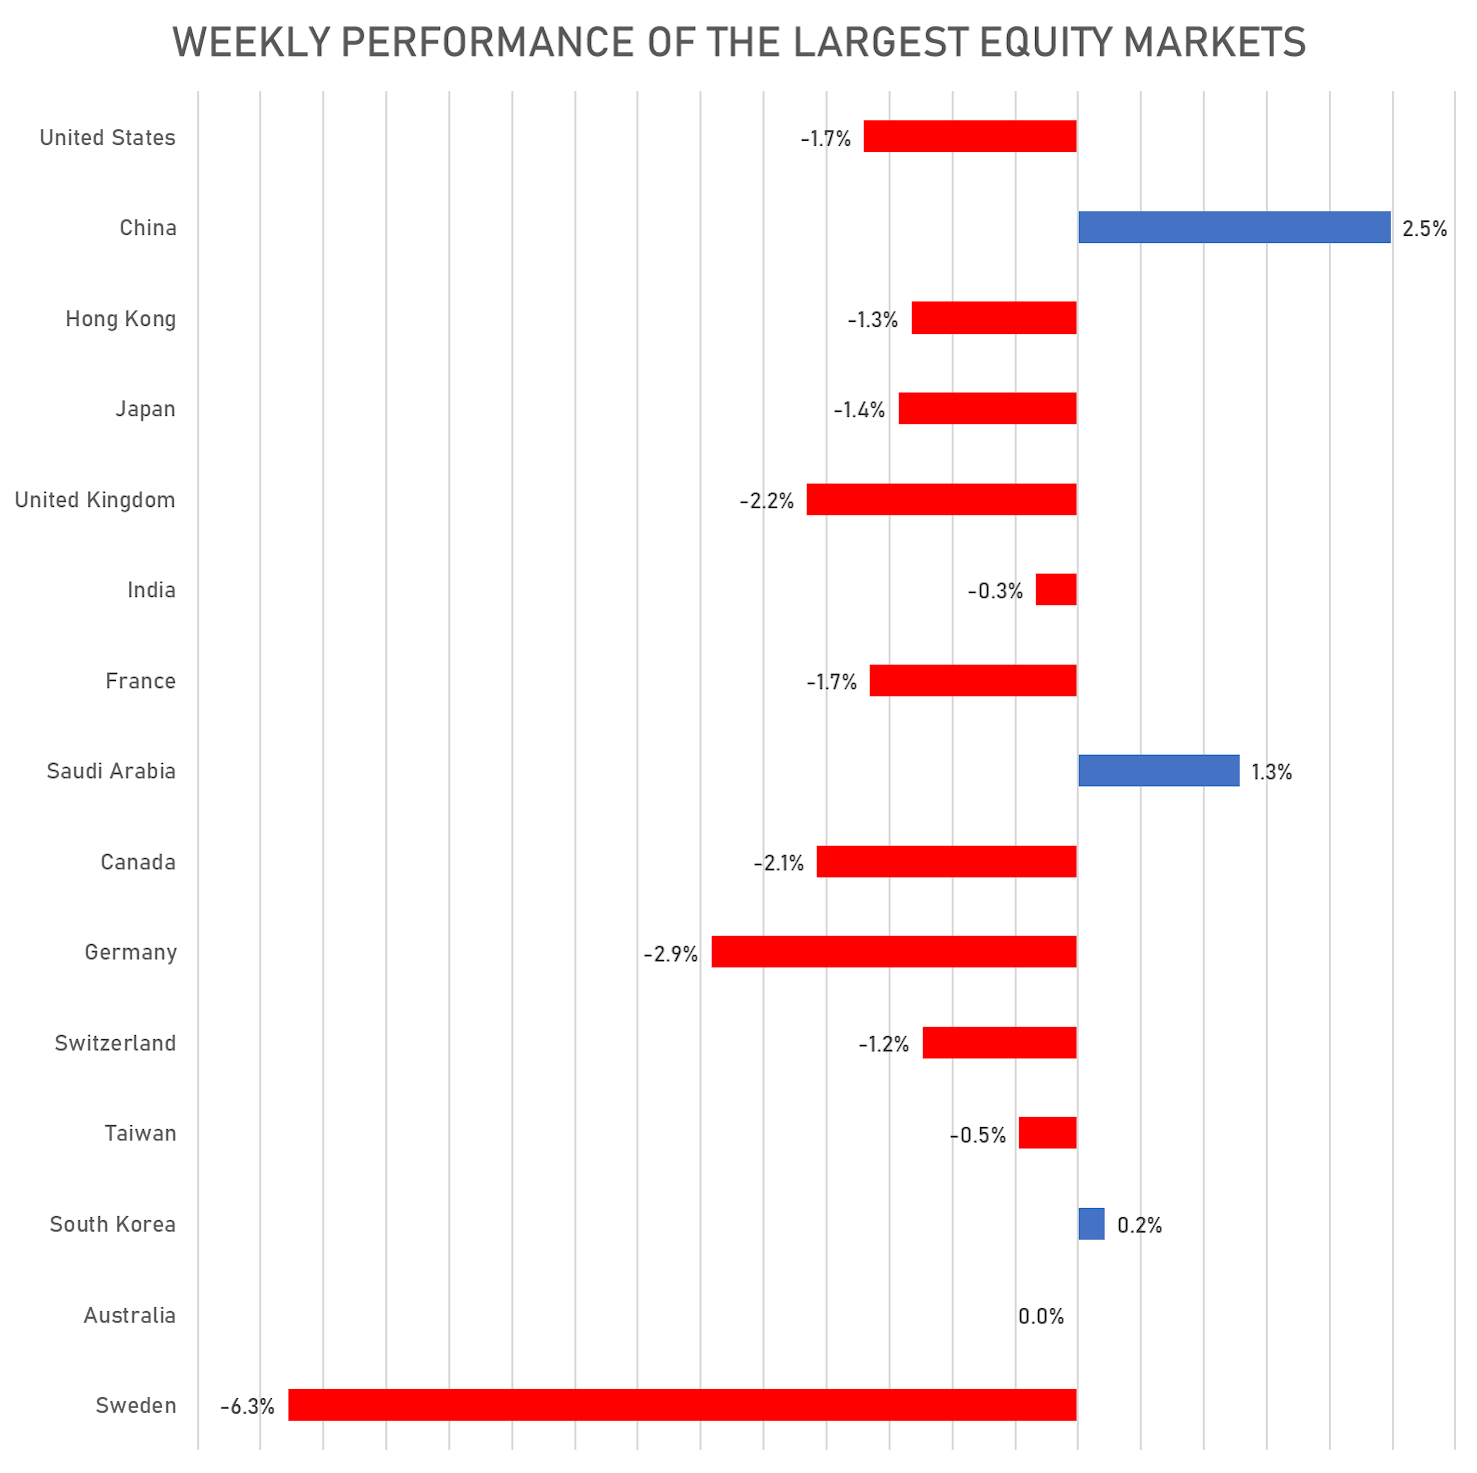
Another Week Of Losses Across Most Equity Markets, With The US Down 1.7%, While Mainland China Rebounded 2.5%
David Kostin, US equity strategist at Goldman Sachs, recently downgraded his forecast for the S&P 500 at the end of the year to 4,900 (from 5,100), a potential upside of about 13% from where we stand today; he views returns this year as solely driven by earnings growth, with multiples coming down
Published ET
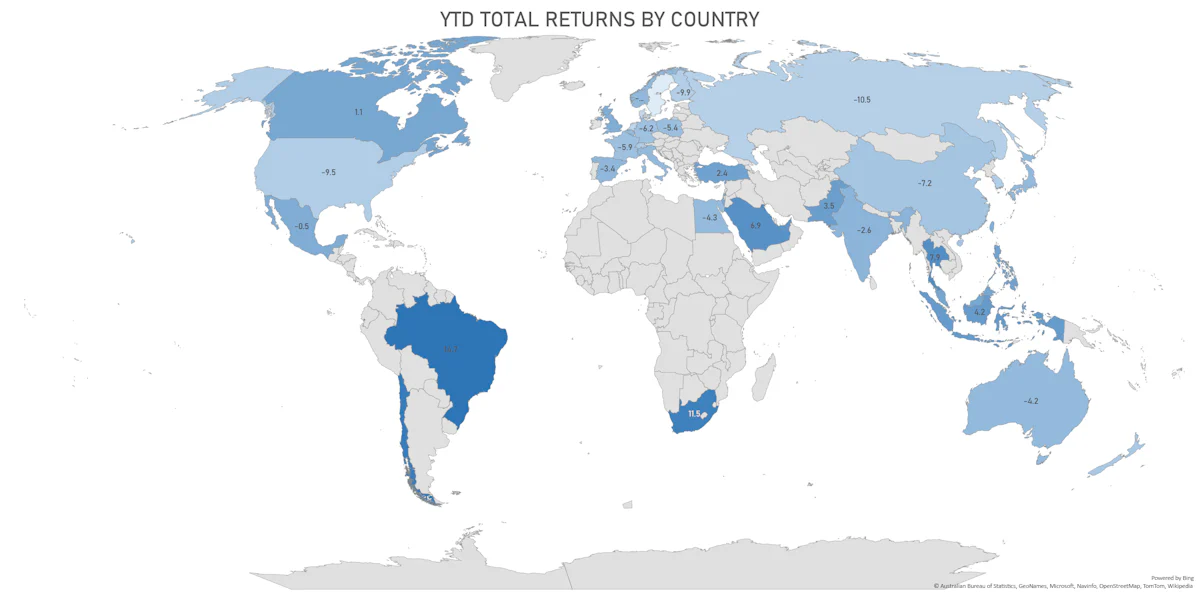
Year-To-Date Total Returns By Country | Sources: ϕpost, FactSet data
QUICK SUMMARY
- Daily performance of US indices: S&P 500 down -0.72%; Nasdaq Composite down -1.23%; Wilshire 5000 down -0.87%
- 34.3% of S&P 500 stocks were up today, with 43.0% of stocks above their 200-day moving average (DMA) and 34.1% above their 50-DMA
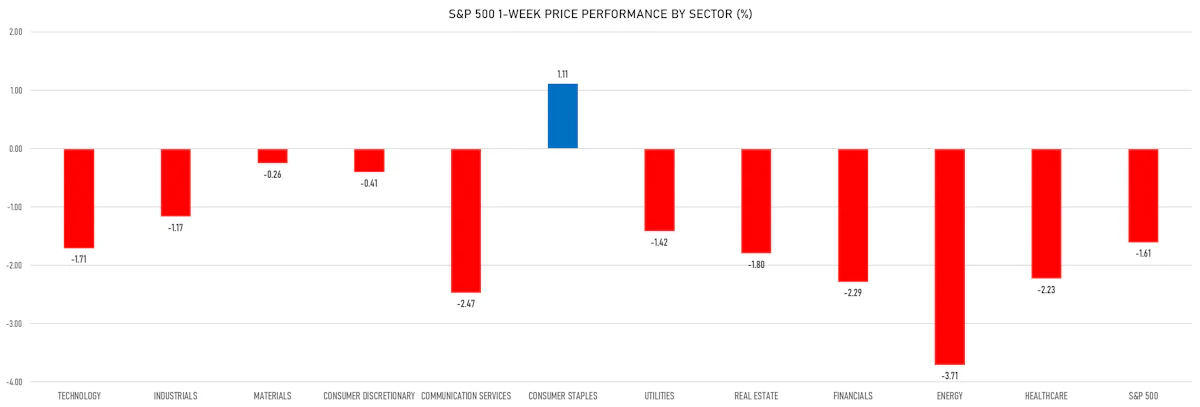
- Top performing sectors in the S&P 500: consumer staples up 0.11% and financials down -0.12%
- Bottom performing sectors in the S&P 500: technology down -1.10% and industrials down -0.91%
- The number of shares in the S&P 500 traded today was 791m for a total turnover of US$ 91 bn
- The S&P 500 Value Index was down -0.5%, while the S&P 500 Growth Index was down -1.0%; the S&P small caps index was down -0.5% and mid-caps were down -0.5%
- The volume on CME's INX (S&P 500 Index) was 2.6m (3-month z-score: 0.1); the 3-month average volume is 2.5m and the 12-month range is 1.3 - 4.6m
- Daily performance of international indices: Europe Stoxx 600 down -0.81%; UK FTSE 100 down -0.32%; Hang Seng SH-SZ-HK 300 Index down -0.68%; Japan's TOPIX 500 down -0.36%
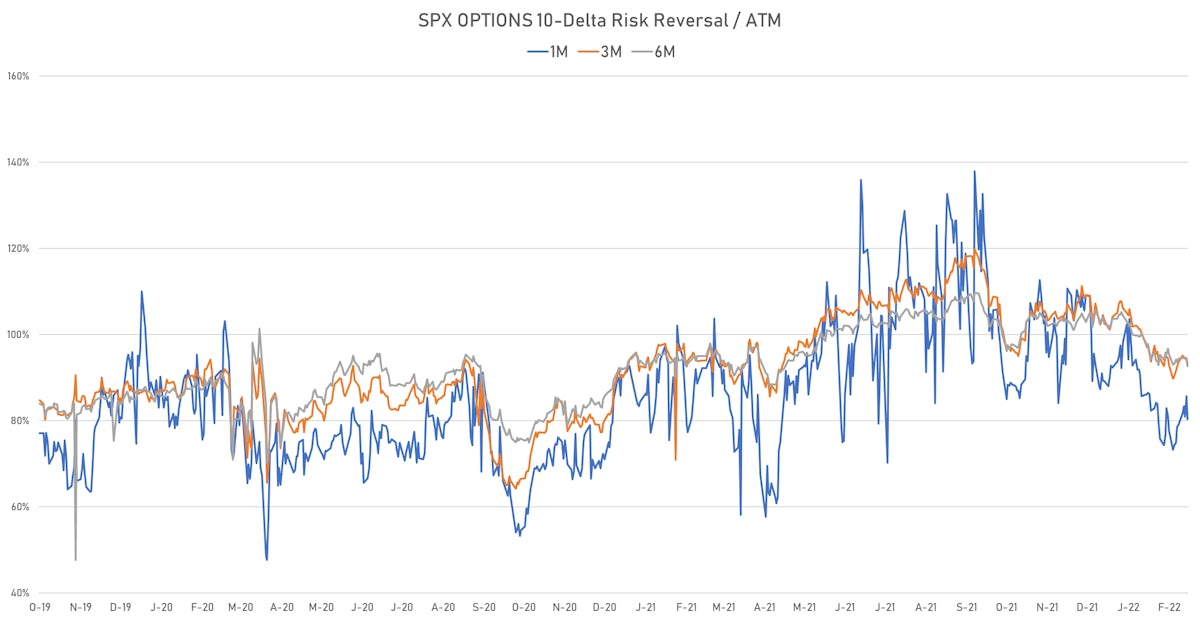
VOLATILITY
- 1-month at-the-money implied volatility on the S&P 500 at 23.0%, up from 22.7%
- 1-month at-the-money implied volatility on the Europe Stoxx 600 at 21.6%, up from 20.0%
NOTABLE US EARNINGS RELEASES
- Deere & Co (DE | Industrials): beat EPS median estimate (2.92 act. vs. 2.22 est.) and beat revenue median estimate (8,531m act. vs. 8,142m est.), down -3.00% today, closed at $ 369.10 / share and traded at $ 367.00 (-0.57%) after hours
- PPL Corp (PPL | Utilities): missed EPS median estimate (0.22 act. vs. 0.32 est.) and missed revenue median estimate (1,485m act. vs. 2,000m est.), down -7.25% today, closed at $ 26.10 / share and traded at $ 26.00 (-0.38%) after hours
- DraftKings Inc (DKNG | Consumer Cyclicals): beat EPS median estimate (-0.80 act. vs. -0.82 est.) and beat revenue median estimate (473m act. vs. 448m est.), down -21.62% today, closed at $ 17.29 / share and traded at $ 17.21 (-0.46%) after hours
TOP WINNERS
- Amplitude Inc (AMPL), up 20.8% to $20.66 / YTD price return: -61.0% / 12-Month Price Range: $ 16.66-87.98 / Short interest (% of float): 4.6%; days to cover: 2.3
- Karyopharm Therapeutics Inc (KPTI), up 19.8% to $14.38 / 12-Month Price Range: $ 4.42-15.40 / Short interest (% of float): 16.6%; days to cover: 5.0
- Amylyx Pharmaceuticals Inc (AMLX), up 15.0% to $26.49 / 12-Month Price Range: $ 16.00-24.50 / Short interest (% of float): 2.5%; days to cover: 2.0
- Appian Corp (APPN), up 12.9% to $55.65 / YTD price return: -14.7% / 12-Month Price Range: $ 46.85-222.25 / Short interest (% of float): 11.7%; days to cover: 7.4
- AMN Healthcare Services Inc (AMN), up 12.2% to $104.65 / YTD price return: -14.5% / 12-Month Price Range: $ 69.50-129.12 / Short interest (% of float): 3.0%; days to cover: 2.4
- Energy Vault Holdings Inc (NRGV), up 11.4% to $12.36 / 12-Month Price Range: $ 8.88-14.10 / Short interest (% of float): 1.5%; days to cover: 3.6
- Matson Inc (MATX), up 11.2% to $97.19 / YTD price return: +8.0% / 12-Month Price Range: $ 59.65-101.72 / Short interest (% of float): 3.5%; days to cover: 3.9
- Hannon Armstrong Sustainable Infrastructure Capital Inc (HASI), up 10.9% to $44.14 / 12-Month Price Range: $ 34.66-65.90 / Short interest (% of float): 8.4%; days to cover: 9.4
- P3 Health Partners Inc (PIII), up 10.8% to $6.10 / 12-Month Price Range: $ 4.58-16.73 / Short interest (% of float): 5.9%; days to cover: 8.3
- Quidel Corp (QDEL), up 10.6% to $97.84 / YTD price return: -27.5% / 12-Month Price Range: $ 88.37-218.40 / Short interest (% of float): 11.1%; days to cover: 3.6
BIGGEST LOSERS
- Cepton Inc (CPTN), down 57.1% to $18.00 / 12-Month Price Range: $ 6.85-80.16 / Short interest (% of float): 3.8%; days to cover: 11.8 (the stock is currently on the short sale restriction list)
- Roku Inc (ROKU), down 22.3% to $112.46 / YTD price return: -50.7% / 12-Month Price Range: $ 139.47-490.76 / Short interest (% of float): 4.9%; days to cover: 1.1 (the stock is currently on the short sale restriction list)
- DraftKings Inc (DKNG), down 21.6% to $17.29 / YTD price return: -37.1% / 12-Month Price Range: $ 17.41-74.38 / Short interest (% of float): 11.9%; days to cover: 1.8 (the stock is currently on the short sale restriction list)
- Redfin Corp (RDFN), down 20.2% to $22.86 / YTD price return: -40.5% / 12-Month Price Range: $ 25.25-98.45 / Short interest (% of float): 12.2%; days to cover: 10.0 (the stock is currently on the short sale restriction list)
- Bakkt Holdings Inc (BKKT), down 17.7% to $5.20 / YTD price return: -38.9% / 12-Month Price Range: $ 3.31-50.80 / Short interest (% of float): 28.9%; days to cover: 1.7 (the stock is currently on the short sale restriction list)
- Braze Inc (BRZE), down 15.3% to $43.68 / YTD price return: -43.4% / 12-Month Price Range: $ 45.06-98.78 / Short interest (% of float): 12.7%; days to cover: 2.6 (the stock is currently on the short sale restriction list)
- Agora Inc (API), down 14.3% to $8.94 / YTD price return: -44.8% / 12-Month Price Range: $ 8.92-99.40 / Short interest (% of float): 9.5%; days to cover: 8.5 (the stock is currently on the short sale restriction list)
- Pilgrims Pride Corp (PPC), down 13.7% to $24.03 / 12-Month Price Range: $ 20.32-29.70 / Short interest (% of float): 5.8%; days to cover: 6.8 (the stock is currently on the short sale restriction list)
- Fubo.tv Inc (FUBO), down 13.5% to $8.40 / YTD price return: -45.9% / 12-Month Price Range: $ 8.74-45.46 / Short interest (% of float): 24.4%; days to cover: 2.9 (the stock is currently on the short sale restriction list)
- Community Health Systems Inc (CYH), down 12.4% to $10.76 / YTD price return: -19.2% / 12-Month Price Range: $ 7.89-17.04 / Short interest (% of float): 3.0%; days to cover: 3.2 (the stock is currently on the short sale restriction list)
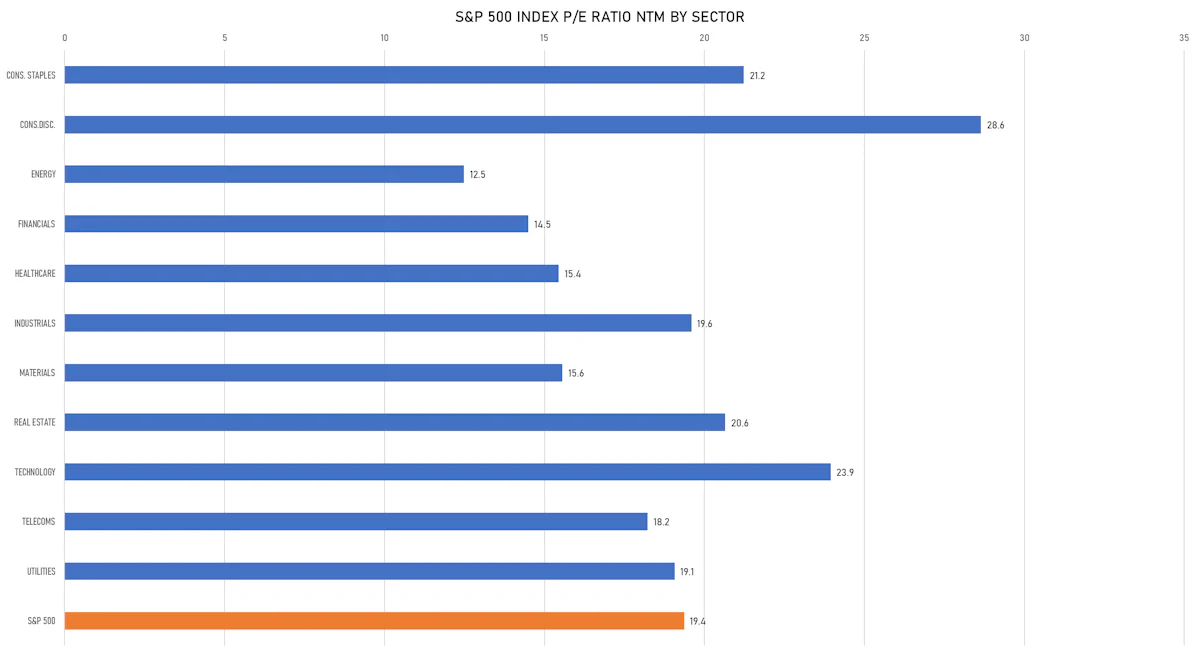
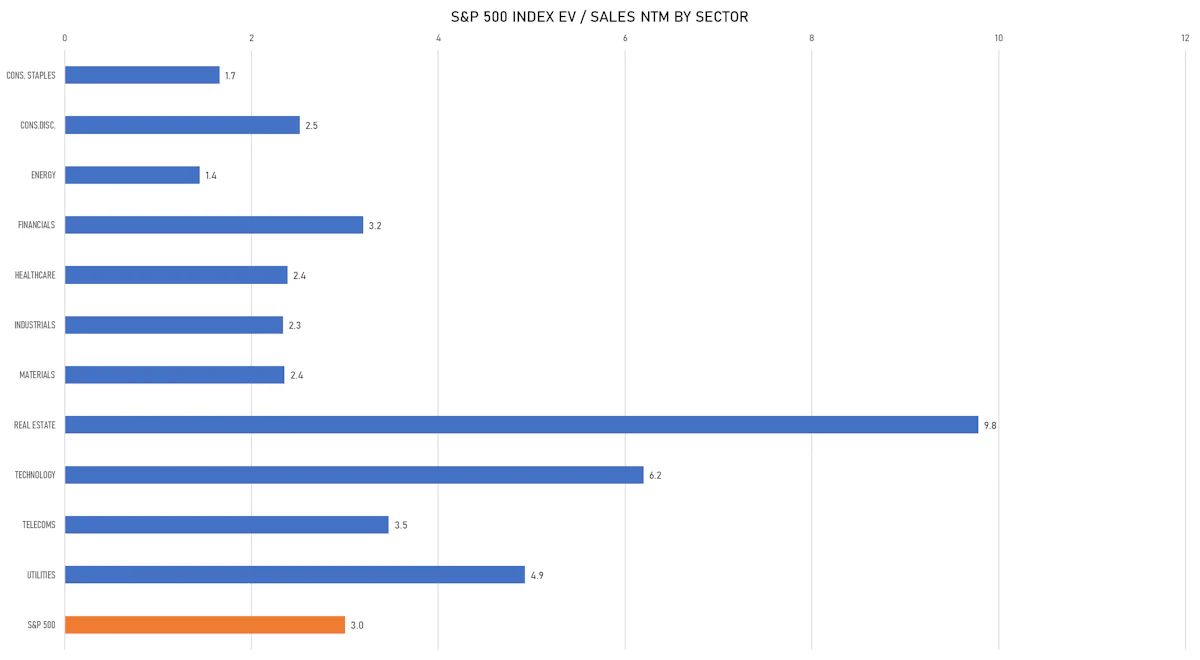
VALUATION MULTIPLES BY SECTORS
WEEKLY PERFORMANCE OF THE LARGEST GLOBAL EQUITY MARKETS
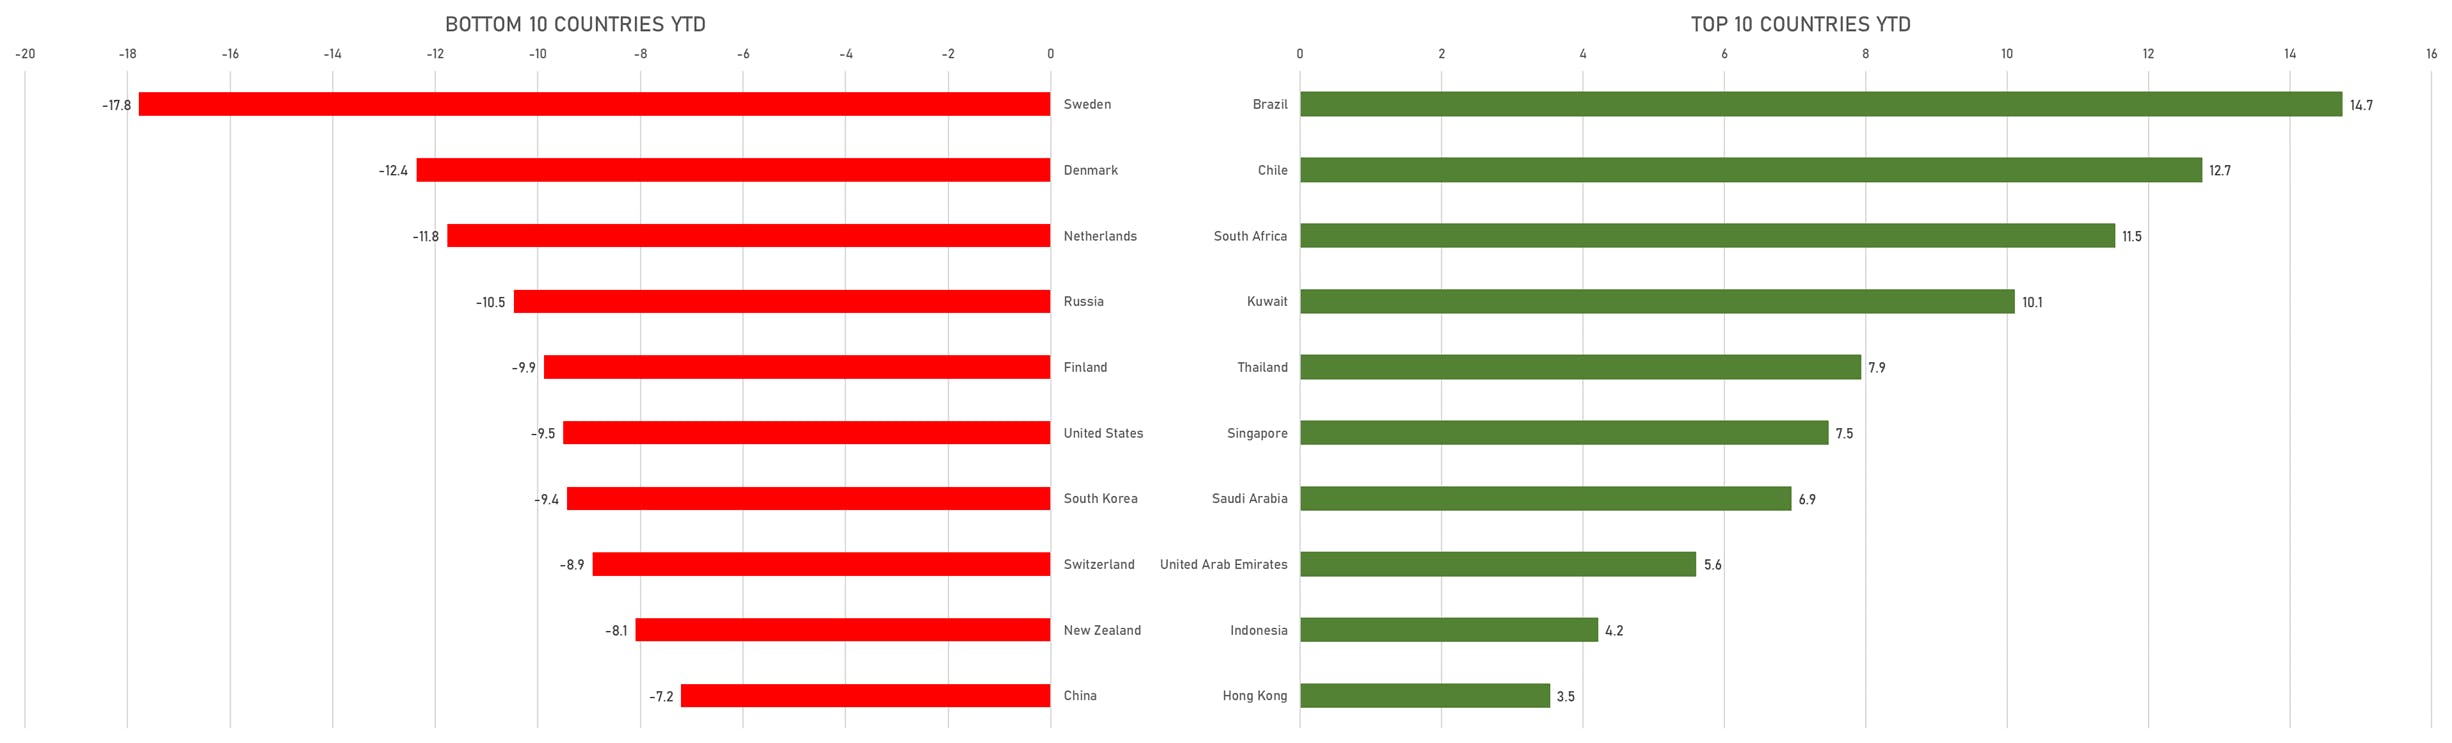
YTD BEST / WORST TOTAL RETURNS BY COUNTRY