Rates
US Rates Volatility Rises, Yields Drop, As Inflation Expectations Are Shortening The Fed Hiking Cycle
Still the same story of breakevens up, real yields down: the Fed will struggle to keep economic growth unharmed when it starts raising the funds rate to contain higher inflation
Published ET

Recent Changes In Eurodollar Futures Implied Yields | Sources: ϕpost, Refinitiv data
QUICK US SUMMARY
- 3-Month USD LIBOR +0.39bp today, now at 0.1456%; 3-Month OIS -0.1bp at 0.0770%
- The treasury yield curve flattened, with the 1s10s spread tightening -3.9 bp, now at 128.7 bp (YTD change: +48.3bp)
- 1Y: 0.1520% (down 1.5 bp)
- 2Y: 0.4227% (down 2.4 bp)
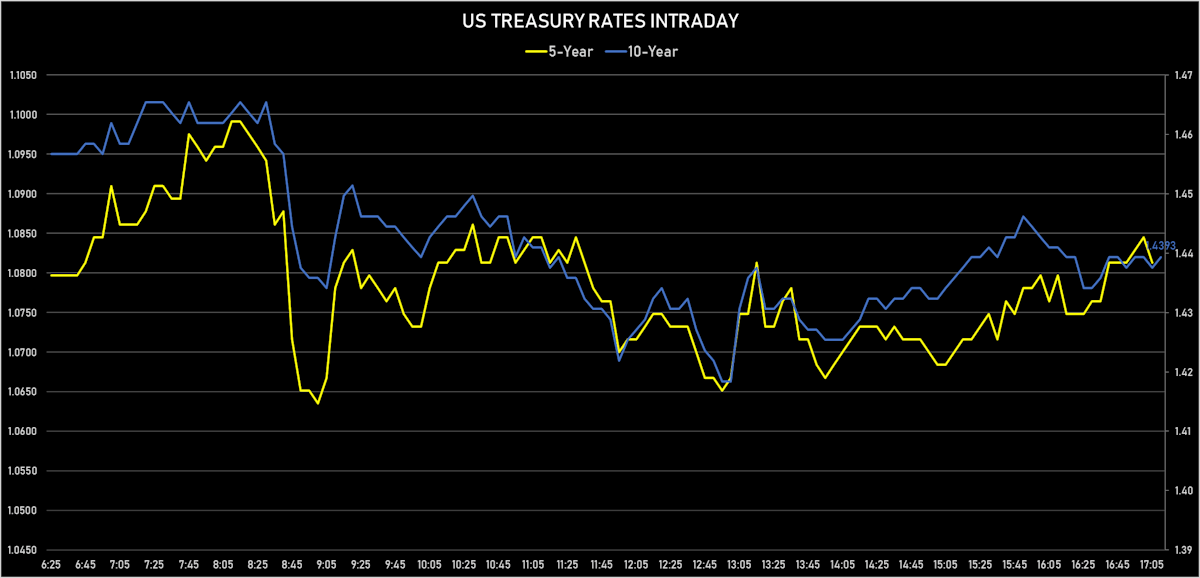
- 5Y: 1.0813% (down 4.1 bp)
- 7Y: 1.3220% (down 5.4 bp)
- 10Y: 1.4393% (down 5.4 bp)
- 30Y: 1.8225% (down 6.7 bp)
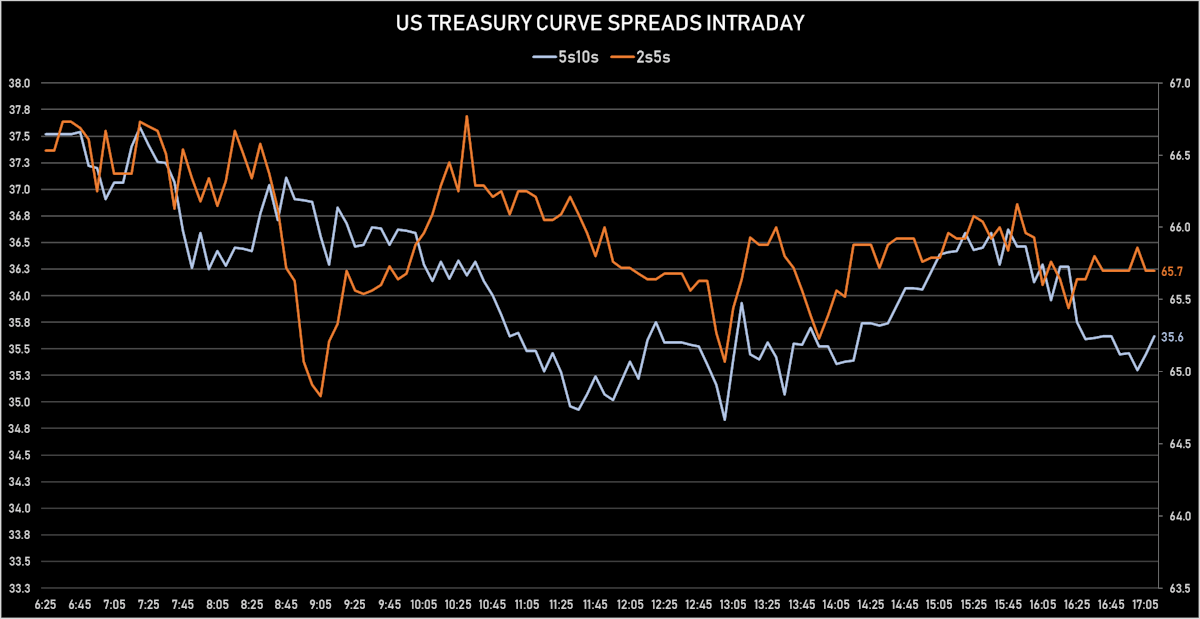
- US treasury curve spreads: 2s5s at 65.9bp (down -1.4bp), 5s10s at 35.8bp (down -1.8bp), 10s30s at 38.4bp (down -1.4bp)
- Treasuries butterfly spreads: 1s5s10s at -59.8bp (up 2.2bp today), 5s10s30s at 2.1bp (up 0.2bp)
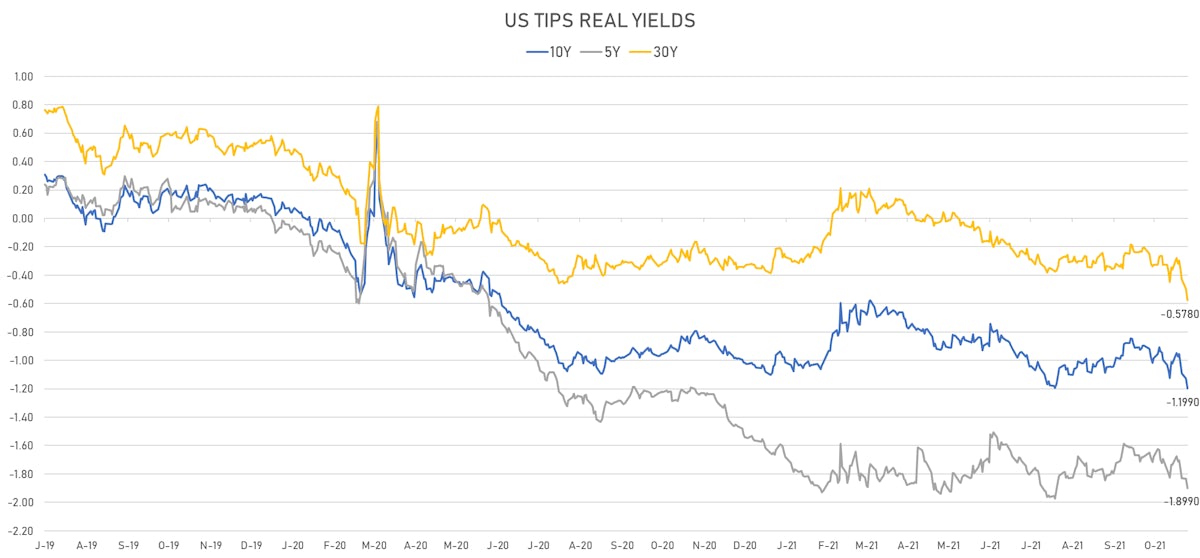
- US 5-Year TIPS Real Yield: -6.6 bp at -1.8990%; 10-Year TIPS Real Yield: -7.1 bp at -1.1990%; 30-Year TIPS Real Yield: -8.1 bp at -0.5780%
$39BN 10-YEAR 1.375% COUPON TREASURY NOTE AUCTION (91282CDJ7)
- Bad results with terrible pricing and weak overall demand despite a $2bn reduction in size
- High yield at 1.444% (vs 1.584% prior), a tail of 1.2 bp vs the when-issued at the bid deadline
- Bid-to-cover at 2.35 (vs 2.58 prior and 2.46 average)
- Direct bids at 13.8% (vs 17.7% prior and 16.7% average)
- Indirect bids at 71.0% (vs 71.1% prior and 64.0% average)
- End users at 84.8% (vs 88.8% prior and 80.6% average)
US MACRO RELEASES
- NFIB, Index of Small Business Optimism for Oct 2021 (NFIB, United States) at 98.20 (vs 99.10 prior)
- Producer Prices, Final demand less foods and energy, Change Y/Y for Oct 2021 (BLS, U.S Dep. Of Lab) at 6.80 % (vs 6.80 % prior), in line with consensus
- Producer Prices, Final demand less foods and energy, Change P/P for Oct 2021 (BLS, U.S Dep. Of Lab) at 0.40 % (vs 0.20 % prior), below consensus estimate of 0.50 %
- PPI ex Food/Energy/Trade YY, Change Y/Y, Price Index for Oct 2021 (BLS, U.S Dep. Of Lab) at 6.20 % (vs 5.90 % prior)
- Producer Prices, Final demand, Change P/P for Oct 2021 (BLS, U.S Dep. Of Lab) at 0.60 % (vs 0.50 % prior), in line with consensus
- Producer Prices, Final demand, Change Y/Y for Oct 2021 (BLS, U.S Dep. Of Lab) at 8.60 % (vs 8.60 % prior), below consensus estimate of 8.70 %
- PPI ex Food/Energy/Trade MM, Change P/P for Oct 2021 (BLS, U.S Dep. Of Lab) at 0.40 % (vs 0.10 % prior)
- Chain Store Sales, Johnson Redbook Index, yoy% index, Change Y/Y for W 06 Nov (Redbook Research) at 15.60 % (vs 16.90 % prior)
US FORWARD RATES
- 3-month Eurodollar future (EDU2) expected hike of 39.6 bp by the end of 2022 (equivalent to 1.6 hikes by end of 2022), down -3.4 bp today
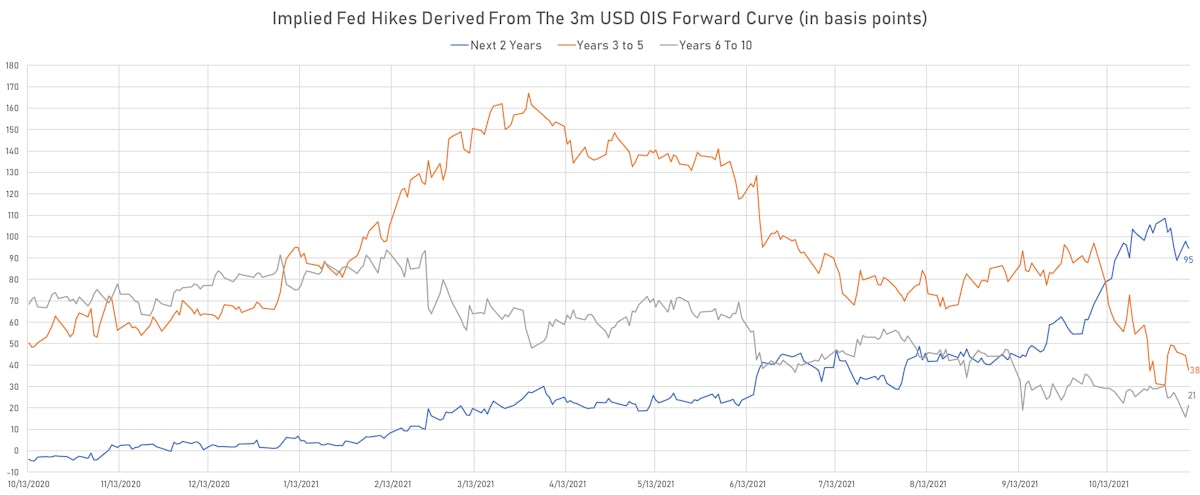
- The 3-month USD OIS forward curve prices in 27.3 bp of rate hikes over the next 12 months (down -0.4 bp today), 67.2 bp of rate hikes over the following year (down -3.1 bp today), and 37.8 bp total rate hikes in years 3 to 5 (down -6.9 bp today)
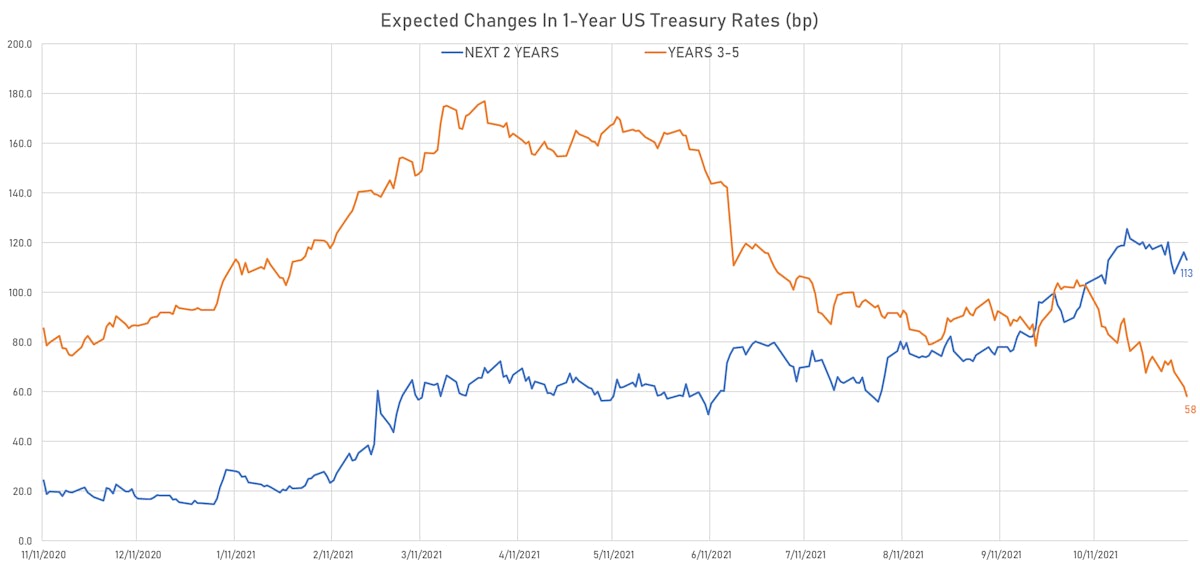
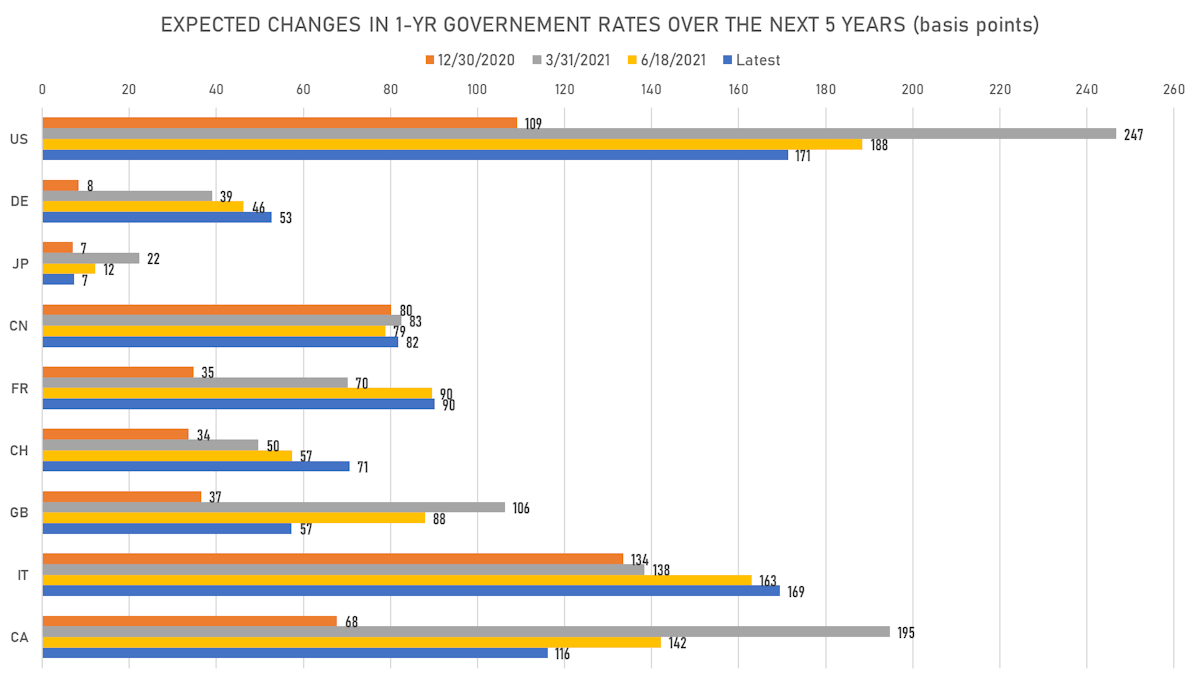
- 1-year US Treasury rate 5 years forward down 8.0 bp, now at 1.8658%, meaning that the 1-year Treasury rate is now expected to increase by 171.4 bp over the next 5 years (equivalent to 6.9 rate hikes)
US INFLATION & REAL RATES
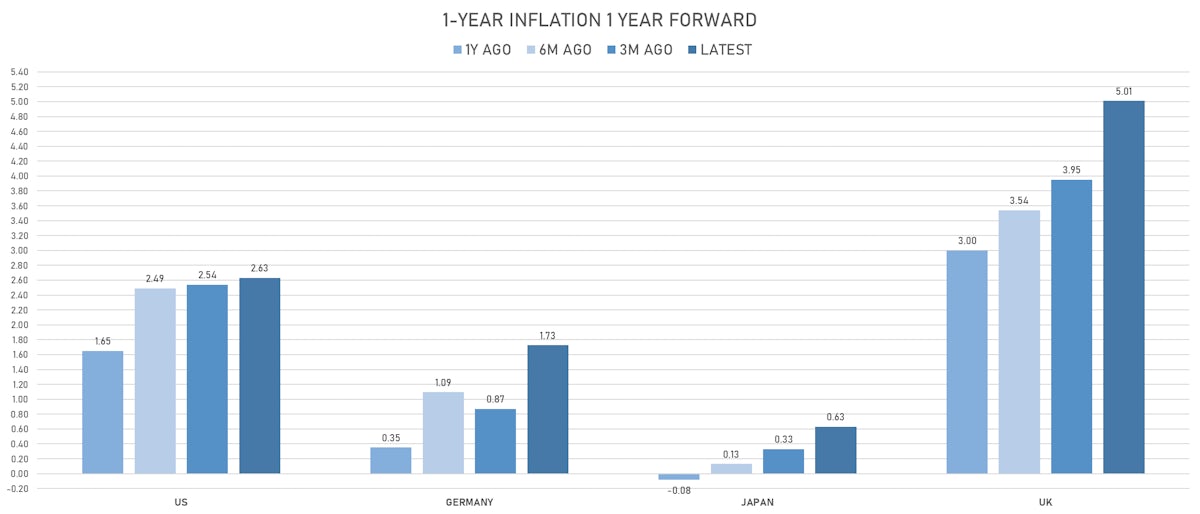
- TIPS 1Y breakeven inflation at 4.28% (up 6.7bp); 2Y at 3.46% (up 4.1bp); 5Y at 3.05% (up 3.5bp); 10Y at 2.61% (up 1.5bp); 30Y at 2.41% (up 1.3bp)
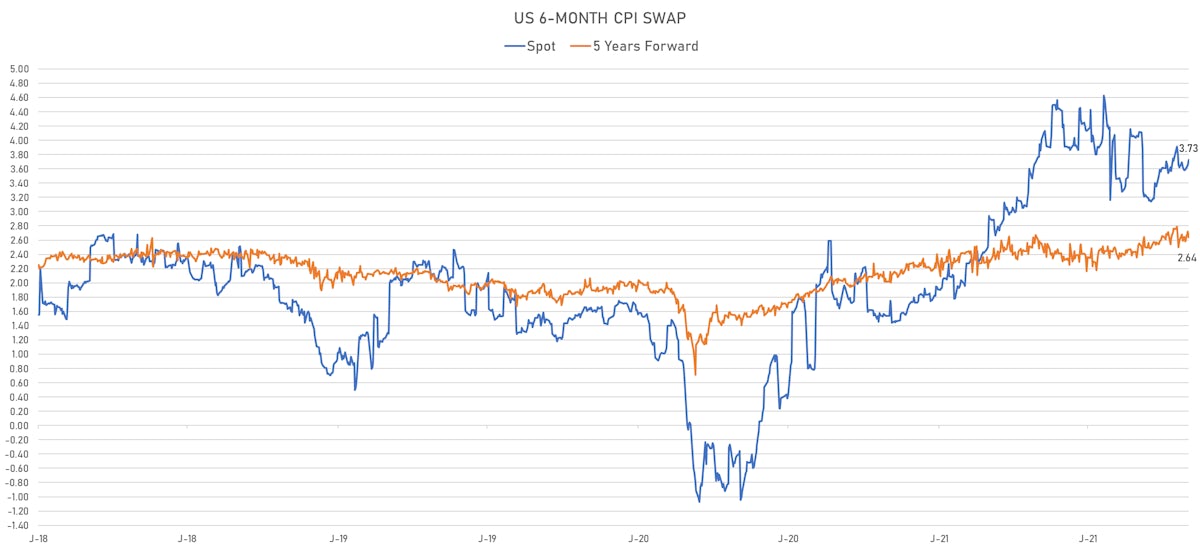
- 6-month spot US CPI swap up 7.7 bp to 3.727%, with a steepening of the forward curve
- US Real Rates: 5Y at -1.8990%, -6.6 bp today; 10Y at -1.1990%, -7.1 bp today; 30Y at -0.5780%, -8.1 bp today
RATES VOLATILITY & LIQUIDITY
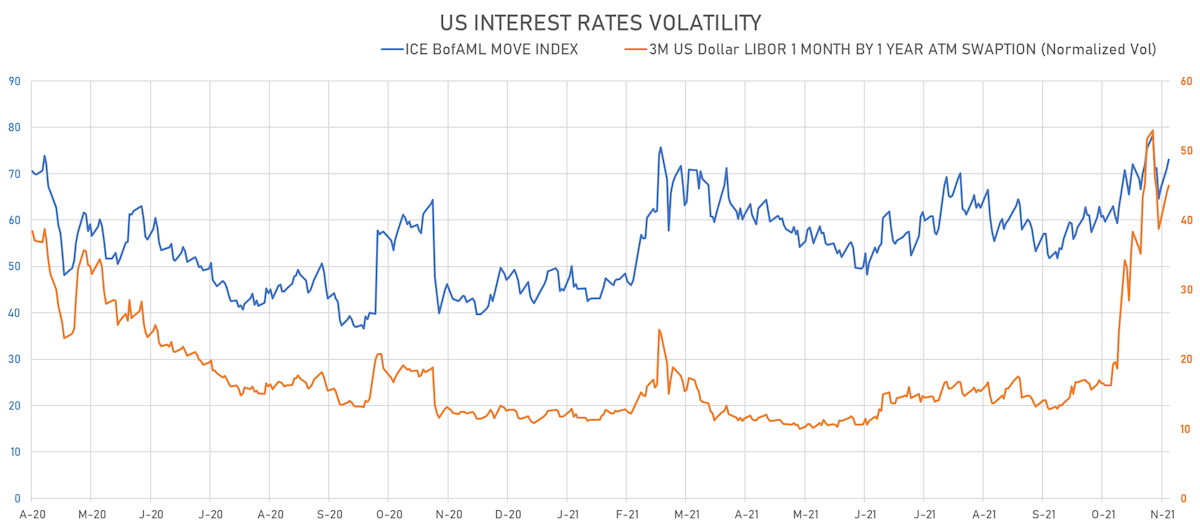
- USD swap rate implied volatility (USD 1 Month by 1 Year ATM Swaption) up 1.2% at 45.0%
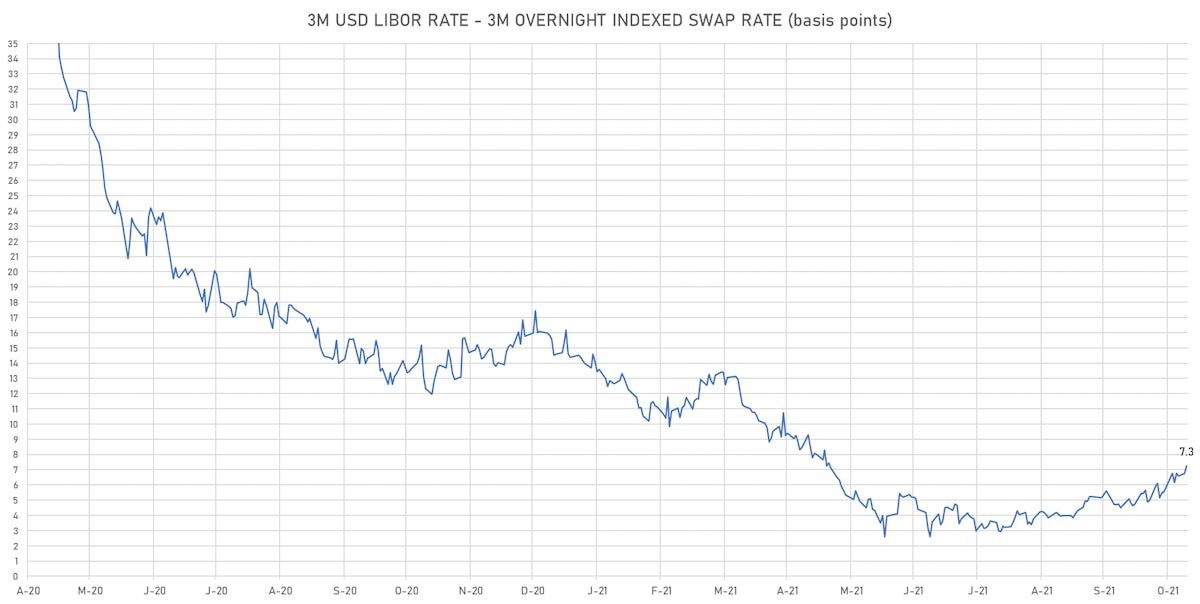
- 3-Month LIBOR-OIS spread up 0.4 bp at 6.9 bp (12-months range: 2.6-17.4 bp)
KEY INTERNATIONAL RATES
- Germany 5Y: -0.588% (down -2.7 bp); the German 1Y-10Y curve is 2.9 bp flatter at 44.4bp (YTD change: +29.1 bp)
- Japan 5Y: -0.093% (up 0.4 bp); the Japanese 1Y-10Y curve is 0.1 bp flatter at 16.0bp (YTD change: +2.3 bp)
- China 5Y: 2.739% (up 1.1 bp); the Chinese 1Y-10Y curve is 0.9 bp steeper at 72.1bp (YTD change: +25.7 bp)
- Switzerland 5Y: -0.461% (down -1.6 bp); the Swiss 1Y-10Y curve is 2.9 bp steeper at 52.4bp (YTD change: +26.0 bp)
