Rates
Rates Rise At The Front End, Fall Further Down The Curve; Inflation Breakevens Up Sharply, Real Yields Down
An avalanche of data today releases created a lot of intraday volatility for rates; Morgan Stanley economists upgraded dramatically their 4Q21 US GDP forecast from 3.0% to 8.7%
Published ET

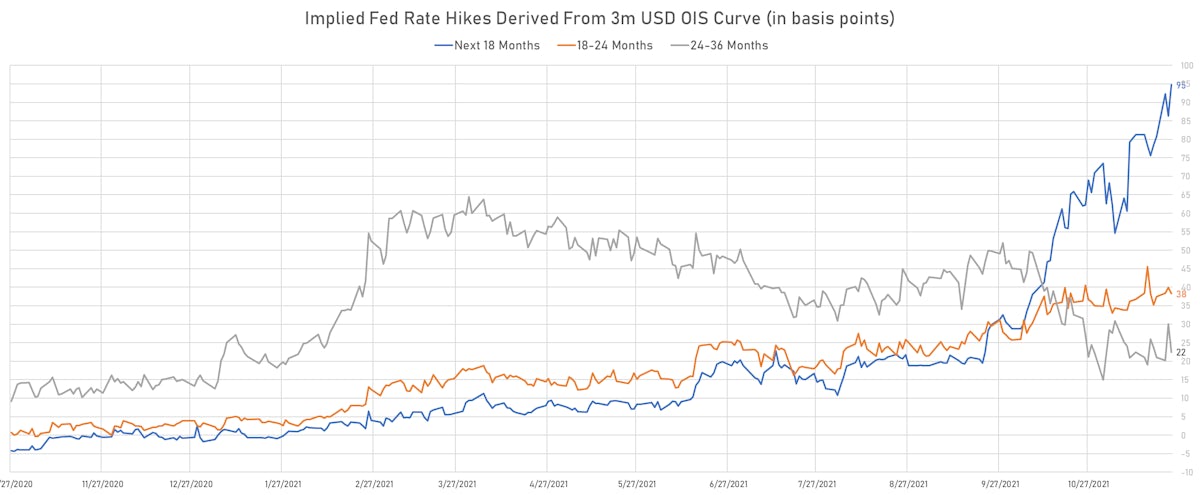
Fed Hikes Priced Into The 3M USD OIS Forward Curve | Sources: ϕpost, Refinitiv data
QUICK US SUMMARY
- 3-Month USD LIBOR +0.23bp today, now at 0.1803%; 3-Month OIS unchanged at 0.0845%
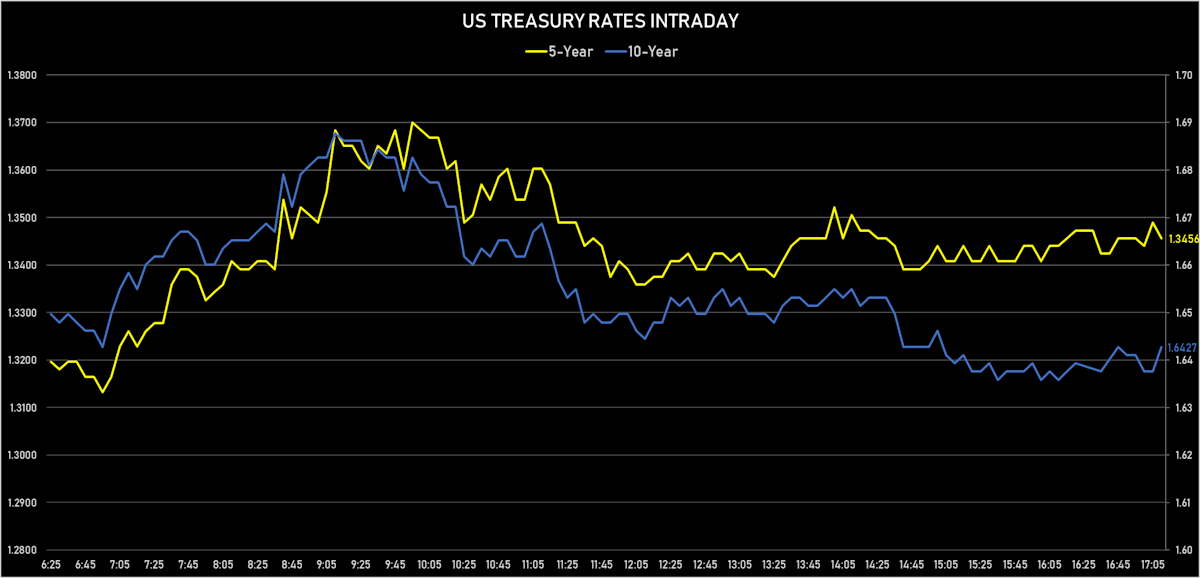
- The treasury yield curve flattened, with the 1s10s spread tightening -6.3 bp, now at 148.3 bp (YTD change: +67.8bp)
- 1Y: 0.1930% (up 3.1 bp)
- 2Y: 0.6142% (up 3.0 bp)
- 5Y: 1.3440% (up 0.2 bp)
- 7Y: 1.5851% (down 0.7 bp)
- 10Y: 1.6755% (down 3.3 bp)
- 30Y: 2.0308% (down 6.3 bp)
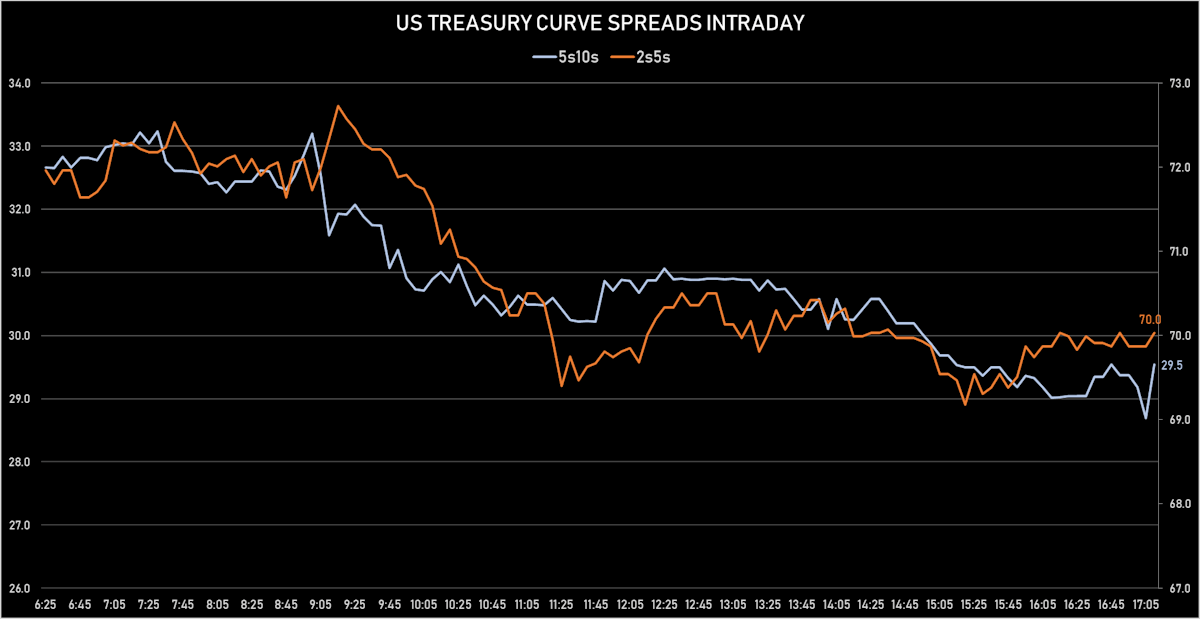
- US treasury curve spreads: 2s5s at 70.2bp (down -2.3bp), 5s10s at 29.7bp (down -3.4bp), 10s30s at 32.5bp (down -3.2bp)
- Treasuries butterfly spreads: 1s5s10s at -84.7bp (down -1.1bp), 5s10s30s at 2.7bp (up 0.2bp)
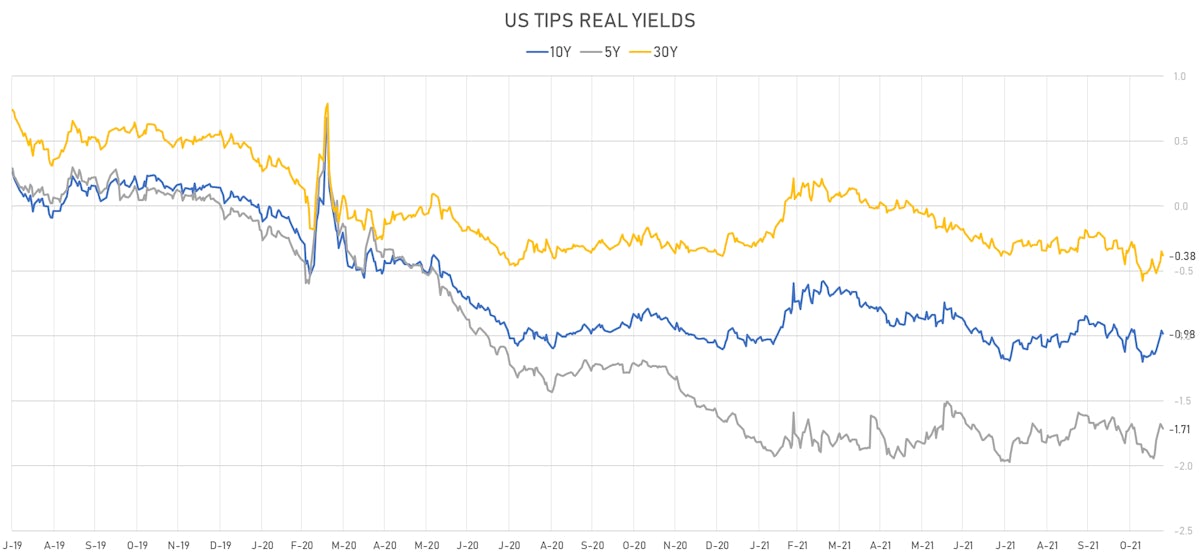
- US 5-Year TIPS Real Yield: -2.4 bp at -1.7130%; 10-Year TIPS Real Yield: -2.6 bp at -0.9840%; 30-Year TIPS Real Yield: -3.2 bp at -0.3810%
US MACRO RELEASES
- Building Permits for Oct 2021 (U.S. Census Bureau) at 1.65 Mln (vs 1.65 Mln prior)
- Building Permits, Change P/P for Oct 2021 (U.S. Census Bureau) at 4.20 % (vs 4.00 % prior)
- Change P/P for Oct 2021 (BEA, US Dept. Of Com) at 0.50 % (vs -1.00 % prior), above consensus estimate of 0.20 %
- Corporate Profits, With IVA and CCAdj, Total-prelim, Change P/P for Q3 2021 (BEA, US Dept. Of Com) at 4.20 % (vs 10.50 % prior)
- GDP, Total-2nd Estimate, Change P/P for Q3 2021 (BEA, US Dept. Of Com) at 2.10 % (vs 2.00 % prior), below consensus estimate of 2.20 %
- Implicit Price Deflator, GDP, Total-prelim, Change P/P for Q3 2021 (BEA, US Dept. Of Com) at 5.90 % (vs 5.70 % prior), above consensus estimate of 5.70 %
- Jobless Claims, National, Continued for W 13 Nov (U.S. Dept. of Labor) at 2.05 Mln (vs 2.08 Mln prior), above consensus estimate of 2.03 Mln
- Jobless Claims, National, Initial for W 20 Nov (U.S. Dept. of Labor) at 199.00 k (vs 268.00 k prior), below consensus estimate of 260.00 k
- Jobless Claims, National, Initial, four week moving average for W 20 Nov (U.S. Dept. of Labor) at 252.25 k (vs 272.75 k prior)
- Manufacturers New Orders, Durable goods excluding defense, Change P/P for Oct 2021 (U.S. Census Bureau) at 0.80 % (vs -1.90 % prior)
- Manufacturers New Orders, Durable goods excluding transportation, Change P/P for Oct 2021 (U.S. Census Bureau) at 0.50 % (vs 0.50 % prior), in line with consensus
- Manufacturers New Orders, Durable goods total, Change P/P for Oct 2021 (U.S. Census Bureau) at -0.50 % (vs -0.30 % prior), below consensus estimate of 0.20 %
- Manufacturers New Orders, Nondefense capital goods excluding aircraft, Change P/P for Oct 2021 (U.S. Census Bureau) at 0.60 % (vs 0.80 % prior), above consensus estimate of 0.50 %
- MBA Mortgage Applications Survey composite index, weekly percentage change, Change P/P for W 19 Nov (MBA, USA) at 1.80 % (vs -2.80 % prior)
- Mortgage applications, market composite index for W 19 Nov (MBA, USA) at 651.30 (vs 639.90 prior)
- Mortgage applications, market composite index, purchase for W 19 Nov (MBA, USA) at 295.70 (vs 282.50 prior)
- Mortgage applications, market composite index, refinancing for W 19 Nov (MBA, USA) at 2,706.20 (vs 2,695.00 prior)
- Mortgage Lending Rates, FRM 30-Year Contract Rate (MBA Sourced) for W 19 Nov (MBA, USA) at 3.24 % (vs 3.20 % prior)
- New Home Sales for Oct 2021 (U.S. Census Bureau) at 0.75 Mln (vs 0.80 Mln prior), below consensus estimate of 0.80 Mln
- New Home Sales, Change P/P for Oct 2021 (U.S. Census Bureau) at 0.40 % (vs 14.00 % prior)
- Personal Consumption Expenditure, Change P/P for Oct 2021 (BEA, US Dept. Of Com) at 0.60 % (vs 0.30 % prior)
- Personal Consumption Expenditure, Change P/P for Oct 2021 (BEA, US Dept. Of Com) at 0.70 % (vs 0.30 % prior)
- Personal Consumption Expenditure, Change P/P for Oct 2021 (BEA, US Dept. Of Com) at 1.30 % (vs 0.60 % prior), above consensus estimate of 1.00 %
- Personal Consumption Expenditure, Change Y/Y for Oct 2021 (BEA, US Dept. Of Com) at 5.00 % (vs 4.40 % prior)
- Personal Consumption Expenditure, Personal consumption expenditures less food and energy, Change P/P for Oct 2021 (BEA, US Dept. Of Com) at 0.40 % (vs 0.20 % prior), in line with consensus
- Personal Consumption Expenditure, Personal consumption expenditures less food and energy, Change Y/Y for Oct 2021 (BEA, US Dept. Of Com) at 4.10 % (vs 3.60 % prior), in line with consensus
- Personal Consumption Expenditure, Profits after tax total-prelim, Change P/P for Q3 2021 (BEA, US Dept. Of Com) at 1.70 % (vs 1.60 % prior)
- Personal Consumption Expenditure, Total, trimmed mean inflation rate (1-month annualized), Change M/M for Oct 2021 (Fed Resrv, Dallas) at 4.20 % (vs 5.10 % prior)
- Personal Consumption Expenditure, Total-prelim, Change P/P for Q3 2021 (BEA, US Dept. Of Com) at 4.50 % (vs 4.50 % prior), in line with consensus
- Personal Consumption Expenditure, Total-prelim, Change P/P for Q3 2021 (BEA, US Dept. Of Com) at 5.30 % (vs 5.30 % prior)
- Retail Inventories Advance, Change P/P for Oct 2021 (U.S. Census Bureau) at 0.40 % (vs 0.70 % prior)
- Total-prelim, Change P/P for Q3 2021 (BEA, US Dept. Of Com) at 0.00 % (vs -0.10 % prior), in line with consensus
- University of Michigan, 5 Year Inflation Expectations (median), Change Y/Y for Nov 2021 (UMICH, Survey) at 3.00 % (vs 2.90 % prior)
- 1 Year Inflation Expectations (median) for Nov 2021 (UMICH, Survey) at 4.90 % (vs 4.90 % prior)
- University of Michigan, Consumer Expectations Index, Volume Index for Nov 2021 (UMICH, Survey) at 63.50 (vs 62.80 prior), above consensus estimate of 63.00
- University of Michigan, Consumer Sentiment Index, Volume Index for Nov 2021 (UMICH, Survey) at 67.40 (vs 66.80 prior), above consensus estimate of 66.90
- University of Michigan, Current Conditions Index, Volume Index for Nov 2021 (UMICH, Survey) at 73.60 (vs 73.20 prior)
- US Adv Goods Trade Balance, Current Prices for Oct 2021 (U.S. Census Bureau) at -82.89 Bln USD (vs -97.03 Bln USD prior)
- Wholesale Inventories Advance, Change P/P for Oct 2021 (U.S. Census Bureau) at 2.20 % (vs 1.40 % prior)
US FORWARD RATES
- 1-month USD OIS imply a change of 63 bp by the end of 2022, equivalent to 2.5 Fed hikes
- 3-month Eurodollar future (EDU2) expected hike of 60.5 bp by the end of 2022 (equivalent to 2.4 hikes by end of 2022), up 4.3 bp today
- The 3-month USD OIS forward curve prices in 48.8 bp of rate hikes over the next 12 months (up 2.5 bp today), 84.3 bp of rate hikes over the following year (up 4.3 bp today), and 21.6 bp total rate hikes in years 3 to 5 (down -14.2 bp today)
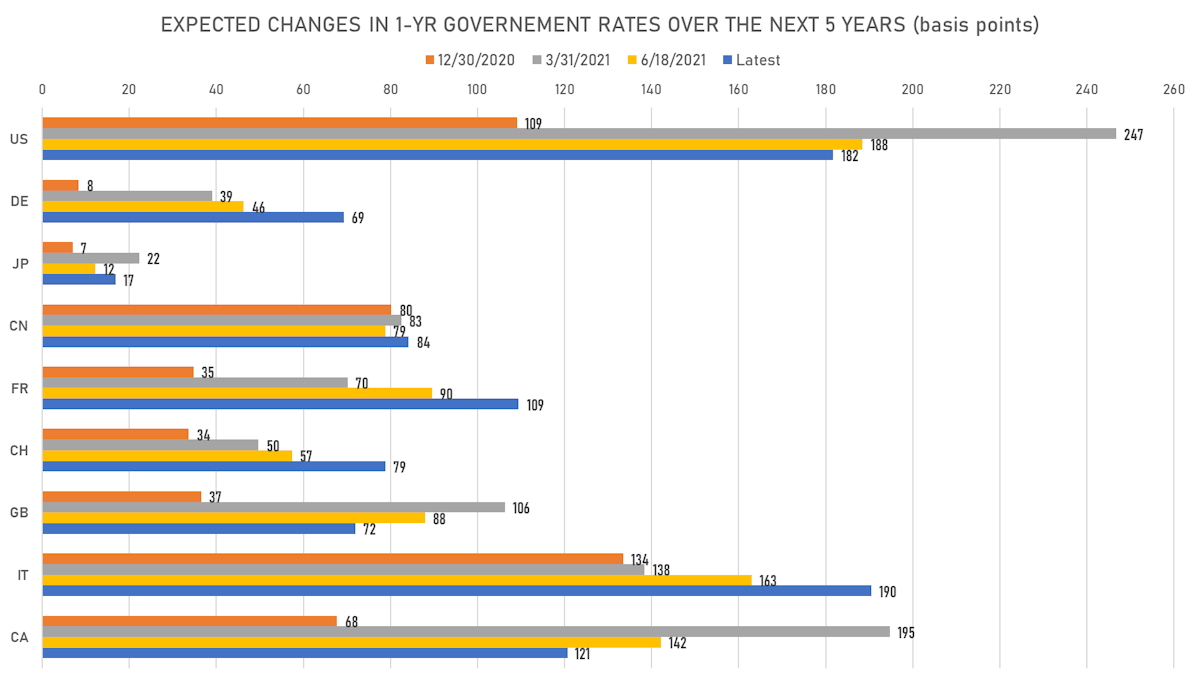
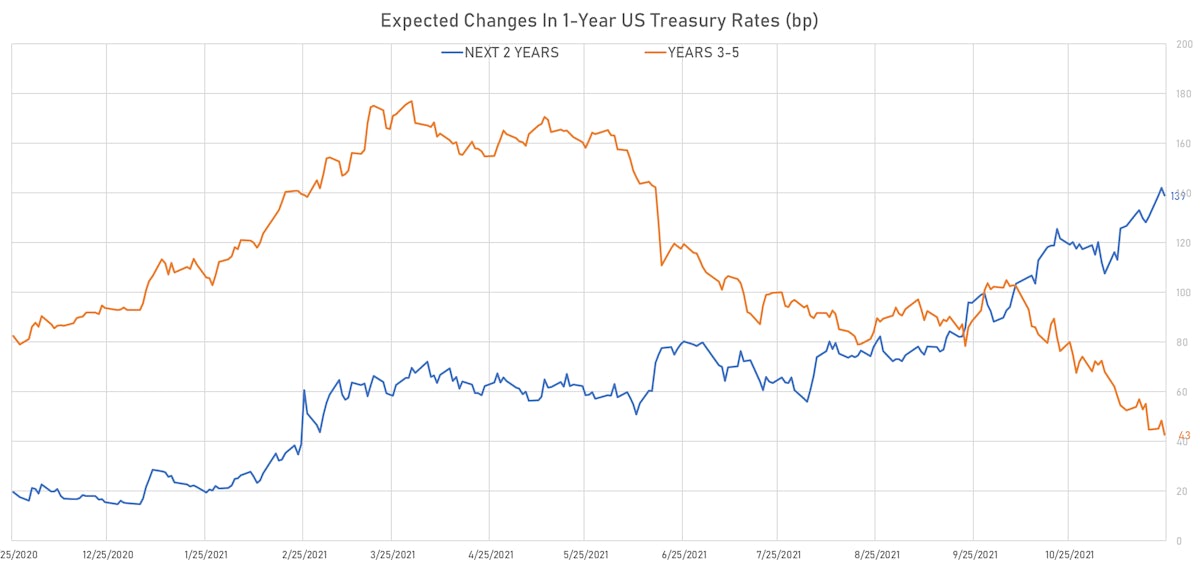
- 1-year US Treasury rate 5 years forward down 5.9 bp, now at 2.0649%, meaning that the 1-year Treasury rate is now expected to increase by 181.6 bp over the next 5 years (equivalent to 7.3 rate hikes)
US INFLATION & REAL RATES
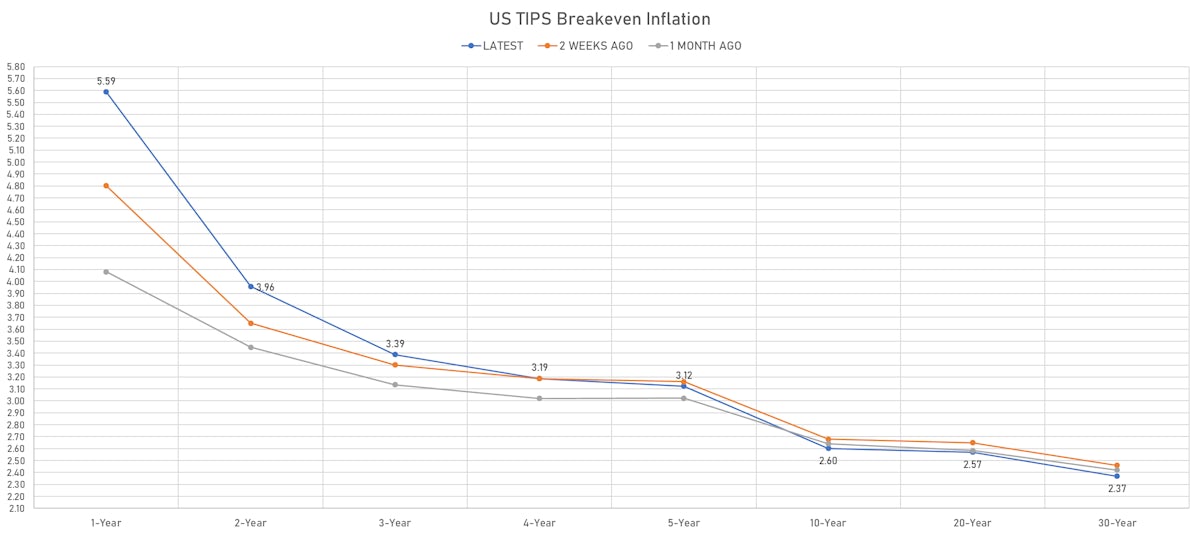
- TIPS 1Y breakeven inflation at 5.59% (up 26.0bp); 2Y at 3.96% (up 14.3bp); 5Y at 3.12% (up 4.0bp); 10Y at 2.60% (down -0.2bp); 30Y at 2.37% (down -2.8bp)
- 6-month spot US CPI swap up 14.7 bp to 4.676%, with a steepening of the forward curve
- US Real Rates: 5Y at -1.7130%, -2.4 bp today; 10Y at -0.9840%, -2.6 bp today; 30Y at -0.3810%, -3.2 bp today
RATES VOLATILITY & LIQUIDITY
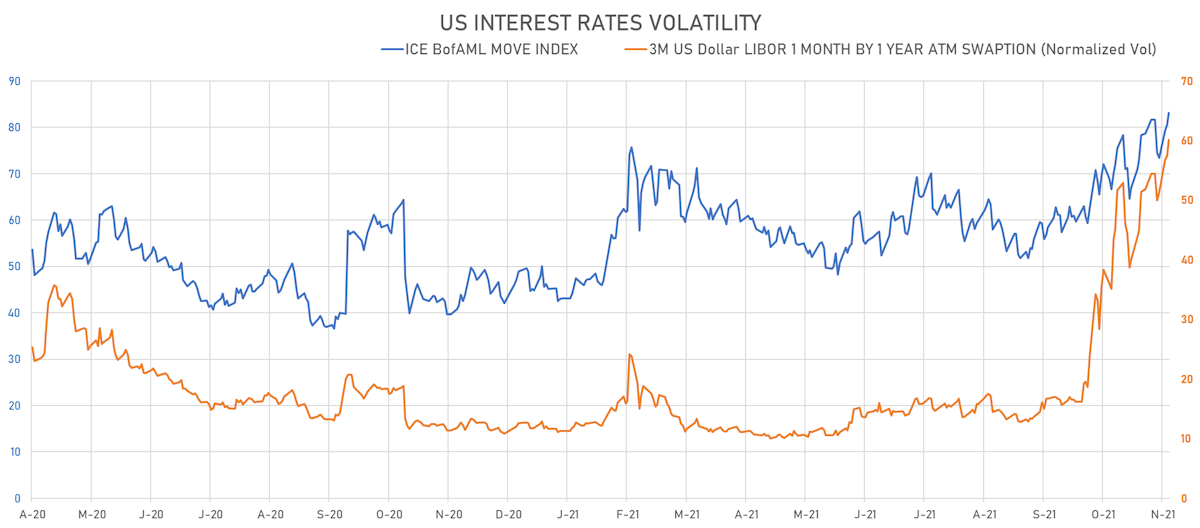
- USD swap rate implied volatility (USD 1 Month by 1 Year ATM Swaption) up 2.7% at 60.1%
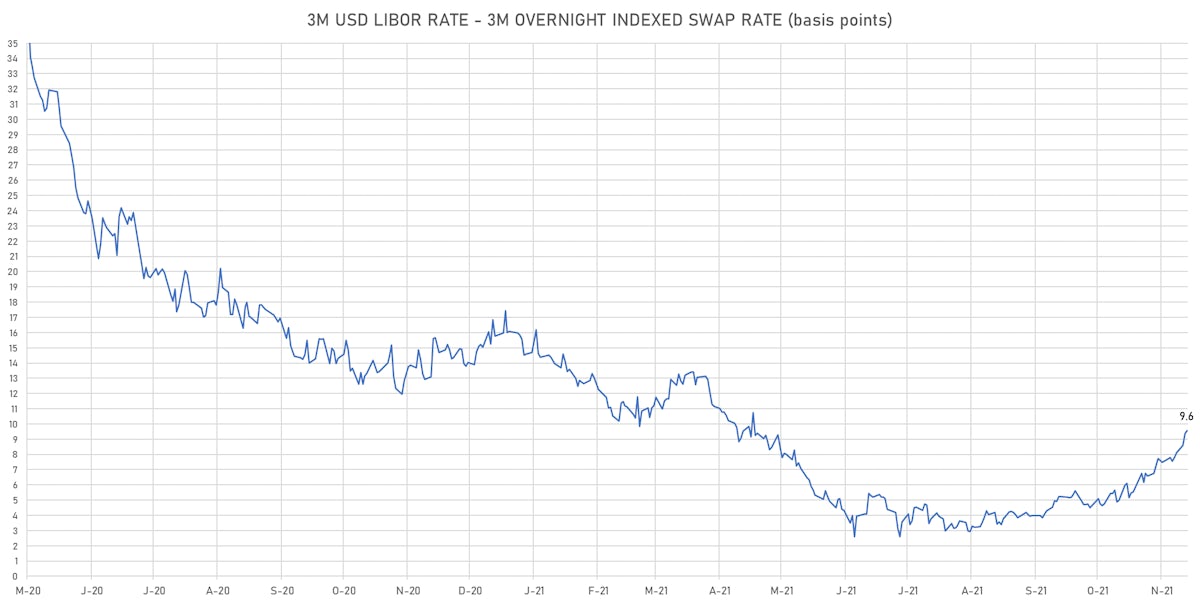
- 3-Month LIBOR-OIS spread up 0.2 bp at 9.6 bp (12-months range: 2.6-17.4 bp)
KEY INTERNATIONAL RATES
- Germany 5Y: -0.551% (unchanged); the German 1Y-10Y curve is 2.4 bp steeper at 52.8bp (YTD change: +38.3 bp)
- Japan 5Y: -0.076% (up 0.4 bp); the Japanese 1Y-10Y curve is 1.3 bp steeper at 21.9bp (YTD change: +6.9 bp)
- China 5Y: 2.703% (down -2.5 bp); the Chinese 1Y-10Y curve is 1.8 bp flatter at 72.9bp (YTD change: +26.5 bp)
- Switzerland 5Y: -0.424% (down -1.0 bp); the Swiss 1Y-10Y curve is 3.6 bp steeper at 62.3bp (YTD change: +36.7 bp)