Rates
The Front End Rates Selloff Continues: Peak Fed Funds Rate Now Above 5.40%, As June FOMC Fully In Play
If confirmed over the coming weeks, the positive recent data in the US could put the Fed in a difficult position at the March FOMC, with the soft-landing scenario becoming increasingly challenged by a more hawkish outlook
Credit
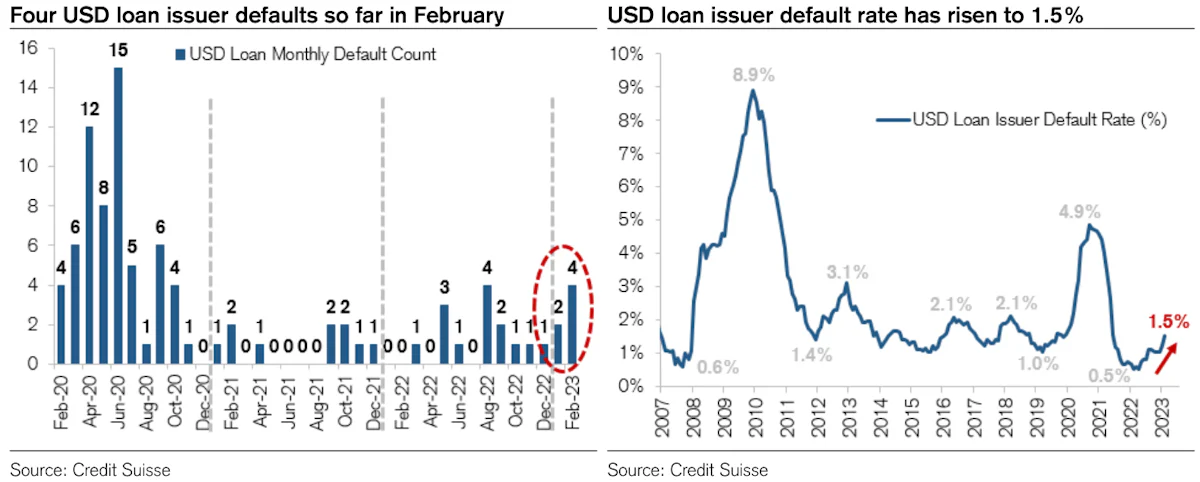
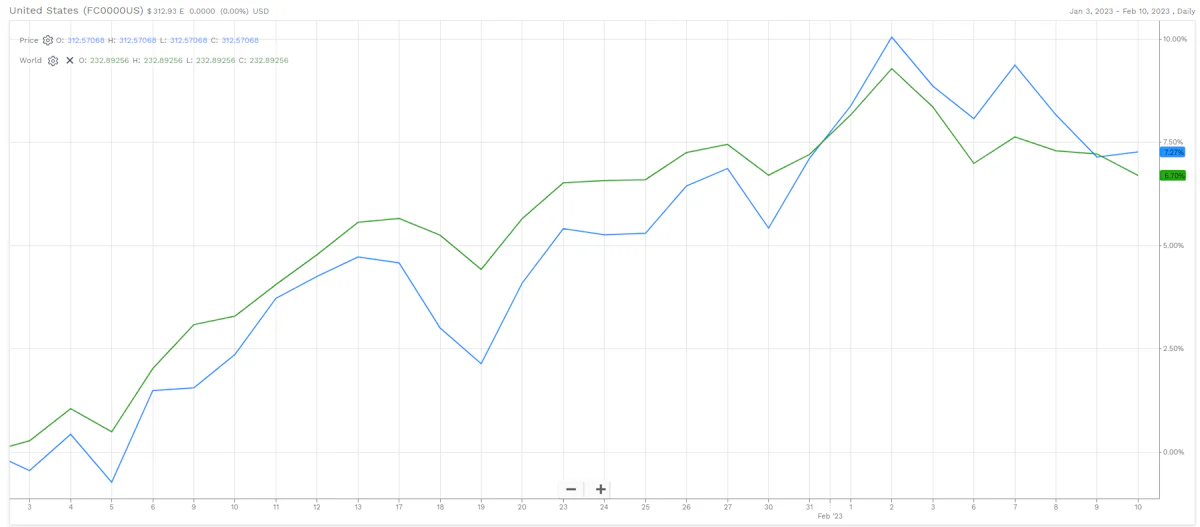
With Default Rates Still At Very Low Levels, Distressed USD HY Is Overperforming US Equities YTD
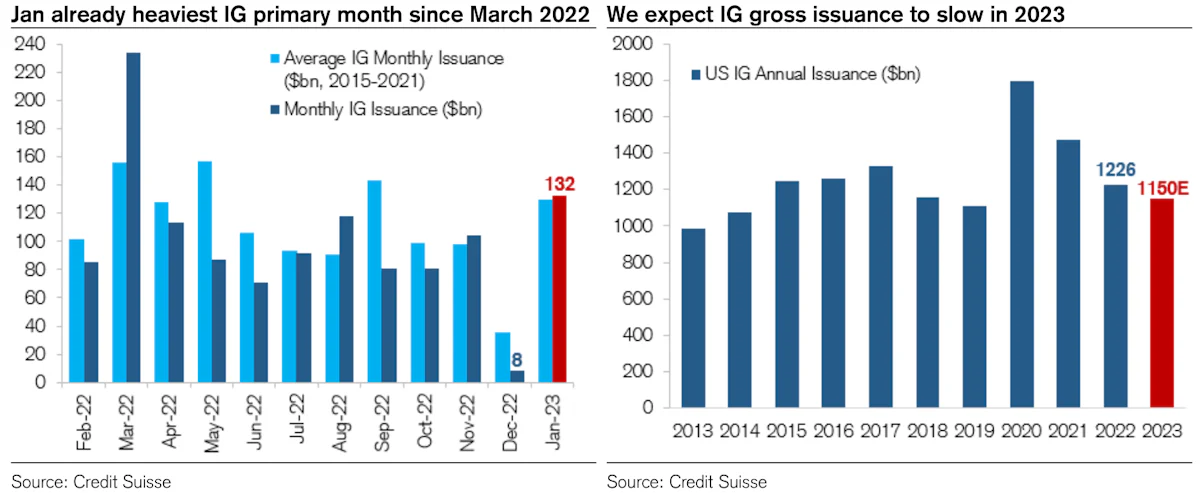
A strong week for investment grade USD bond issuance: 42 tranches for $54.175bn in IG (2023 YTD volume $245.075bn vs 2022 YTD $216.041bn), no new issuance in HY (2023 YTD volume $31.475bn vs 2022 YTD $30.686bn)
Equities
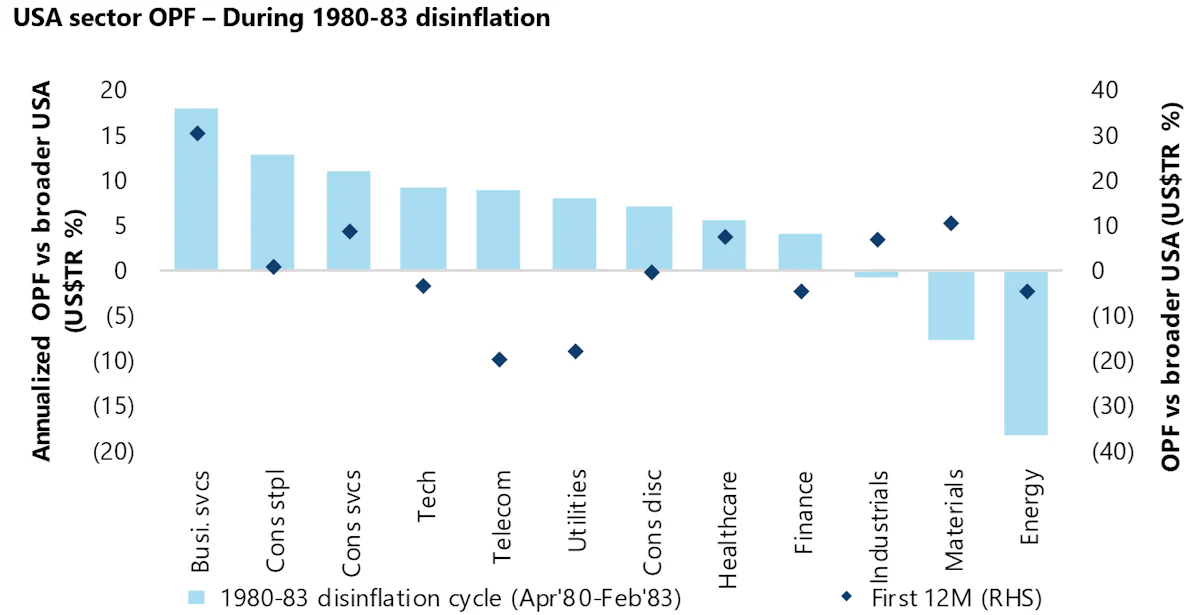
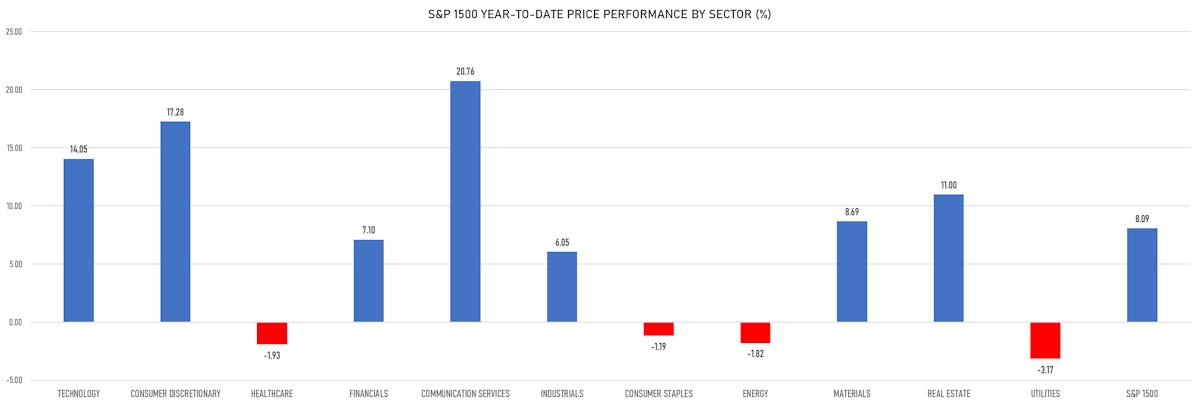
US Equities Fairly Resilient Through Recent Rates Repricing, But Hard To See A Lot Of Upside Given Current Valuations
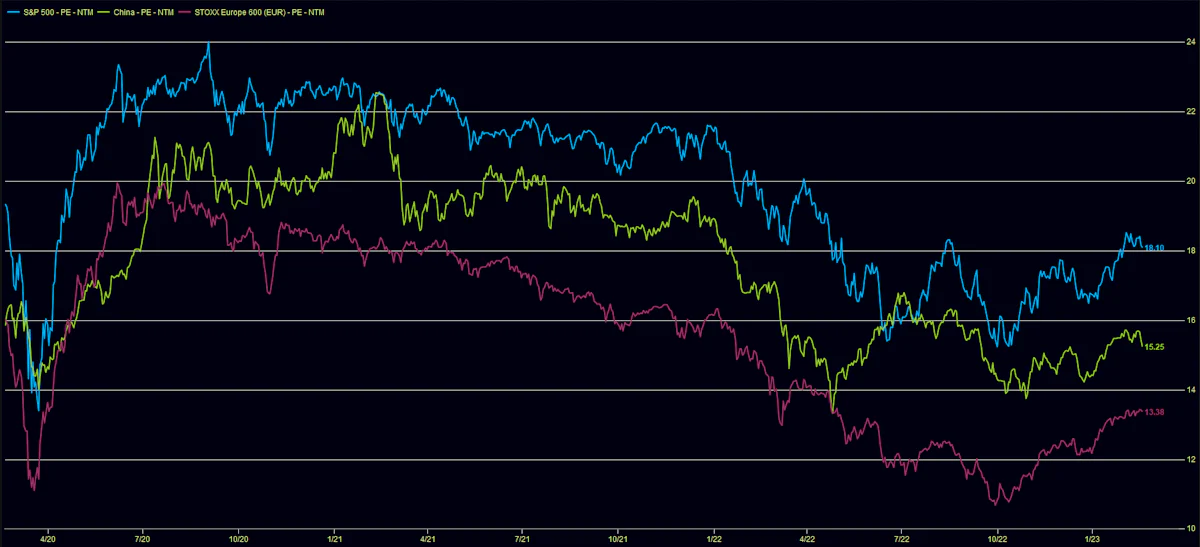
Despite the tremendous rebound in Chinese equities since October, the valuation levels remain reasonable compared to US and European large-cap equivalents
Rates
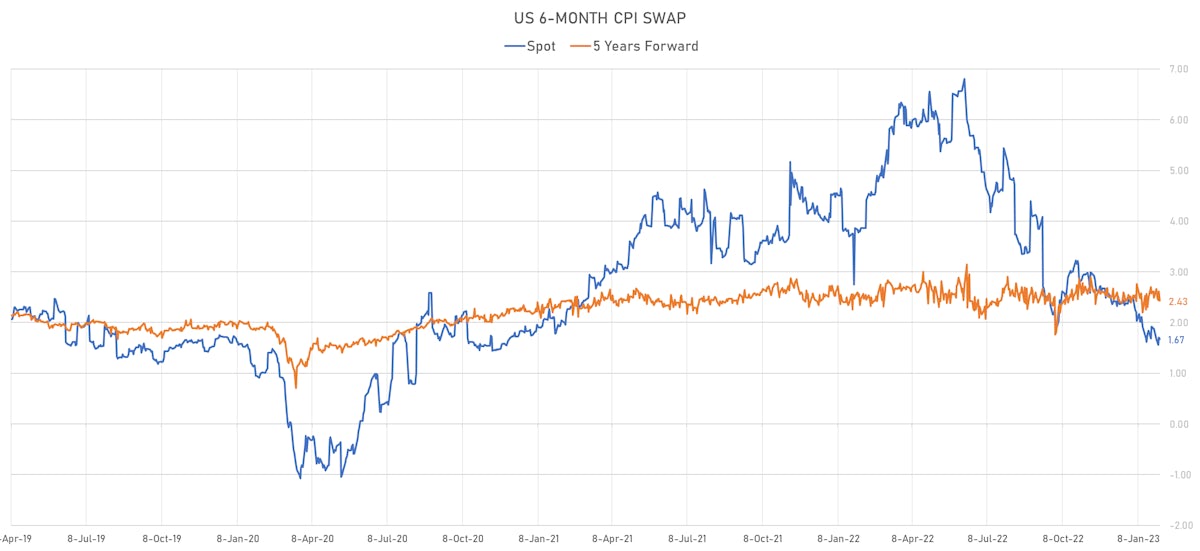
US Rates Sell Off Across The Curve, Led By The Front End, Driven By A Repricing Of Short-Term Inflation Expectations
The recent US activity data has been strong, and core inflation has been coming down very slowly, pointing to a possible reacceleration of inflation: the risk of overtightening has come down and the risk of not doing enough has gone up

Credit
Despite Broadly Wider Spreads, The Compression In US High Yield Continues With CCC-BB Back To August Level
After a good week, YTD volumes of corporate USD bond issuance are now ahead of last year: 33 tranches for $33.7bn in IG (2023 YTD volume $190.9bn vs 2022 YTD $184.465bn), 12 tranches for $8.425bn in HY (2023 YTD 38 Tranches for $31.475bn vs 2022 YTD $30.686bn)
Equities
Derisking Ahead Of Much-Awaited CPI Data After US Equities Start The Year Up 10%
Expectations for FY2023 S&P 500 EPS continue to come down: they were around $250 last year and the median estimate now stands at $227 according to S&P Capital IQ (the consensus still sees around 2.5% EPS growth YoY)
Rates
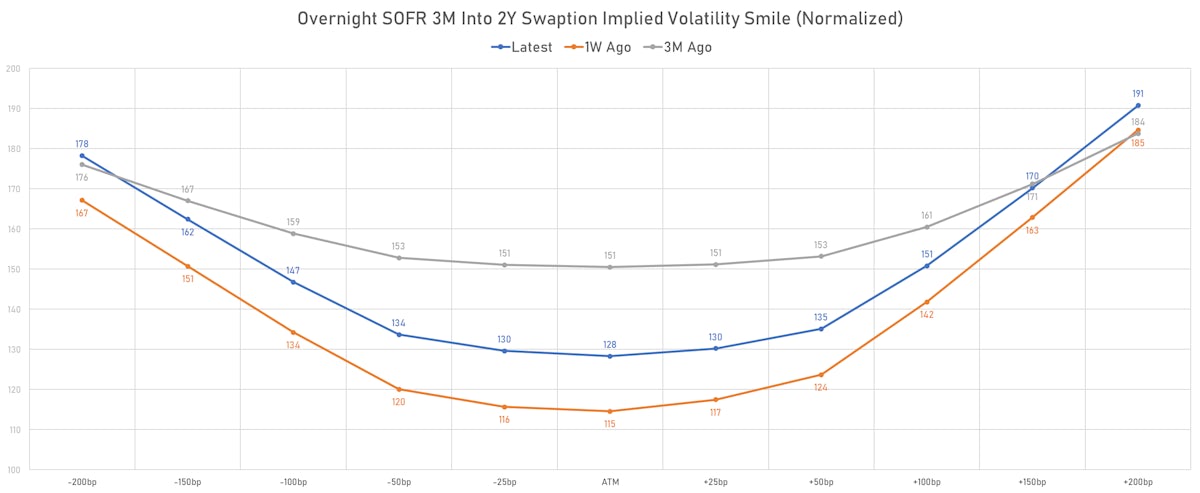
Sharp Rise In Front-End Rates, Inflation Breakevens And Volatility Ahead Of Upcoming January CPI Report
The rise in implied volatilities reflects diminished comfort about the distribution of inflation / rates outcomes, and we've seen slightly more hedging of the left tail (i.e. lower rates) with the recent reduction in the curve inversion
Credit
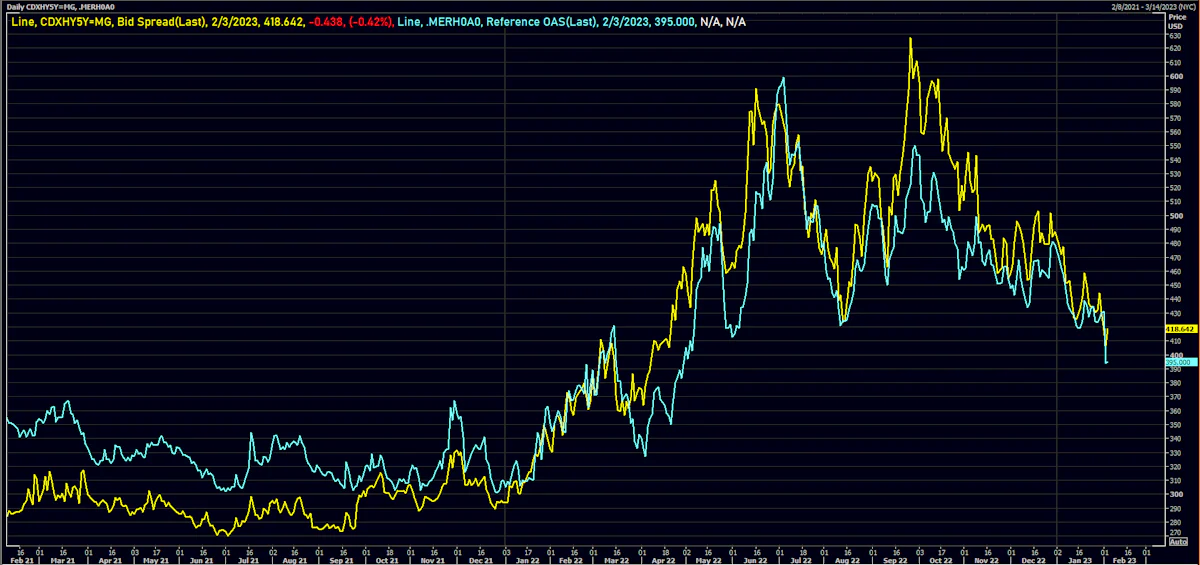
Tighter Spreads Across US Credit This Week, With The CDX HY Trailing HY Cash Performance YTD
Another solid week for US$ corporate bond issuance: 24 tranches for $21.05bn in IG (2023 YTD volume $157.2bn vs 2022 YTD $168.89bn), 5 tranches for $7.6bn in HY (2023 YTD volume $23.05bn vs 2022 YTD $27.936bn)
Equities
Strong NFP Surprise Takes Equities For A Slide Into The Weekend; S&P 500 Still Up 8% YTD
Global equities are off to a spectacular start this year, underpinned by a broadly positive growth outlook and fueled by short covering; estimates of speculative net exposure remain low, meaning that the rally could go on for a while
Rates
Sizable Moves In STIR Markets On Friday As Employment Report Blows Past Expectations, Puts >5% Peak Rate Back In Play
We're getting close to peak US rates, with just 45bp of additional hikes priced in forwards, and yet economic performance remains strong, putting in question whether financial conditions are restrictive enough
Credit
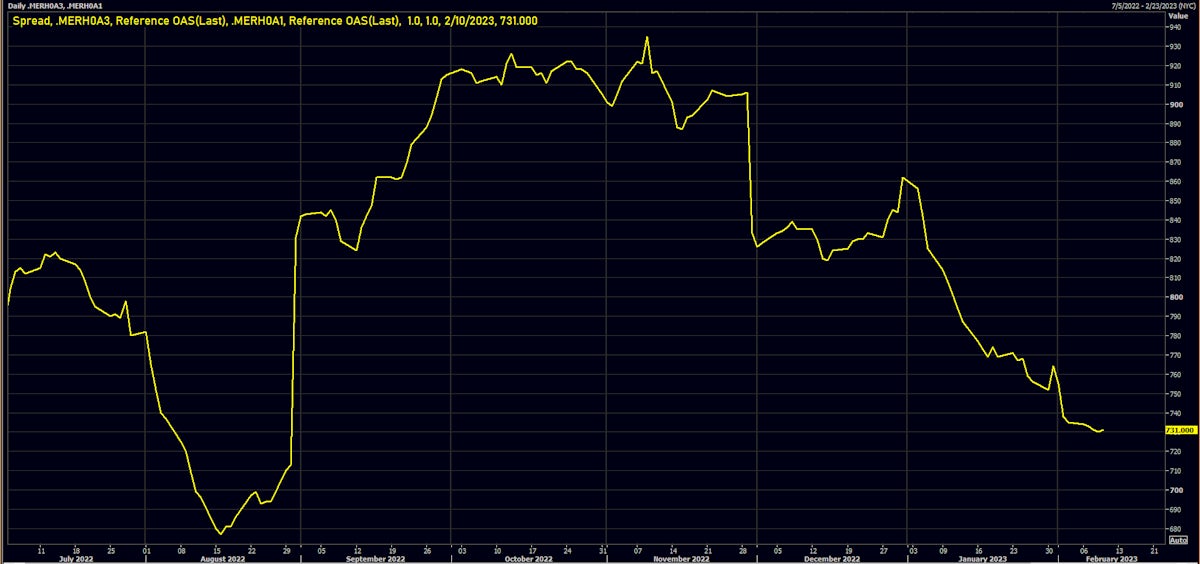
Risk Appetite Brings On HY-IG Spreads Compression; HY Distressed Spreads 350bp Tighter YTD
Weekly volumes of new USD corporate bonds priced (IFR Markets data): 26 tranches for $26bn in IG (2023 YTD volume $136.15bn vs 2022 YTD $148.39bn), 5 tranches for $3.75bn in HY (2023 YTD volume $15.45bn vs 2022 YTD $22.36bn)
Equities
Market Participants Are Taking Advantage Of The Current Equities Rally, Lower Volatility To Buy Downside Protection
Earnings have been unspectacular so far, essentially in line with lowered market expectations; excluding energy, results are down about 5% YoY, with a focus on margin compression