Rates
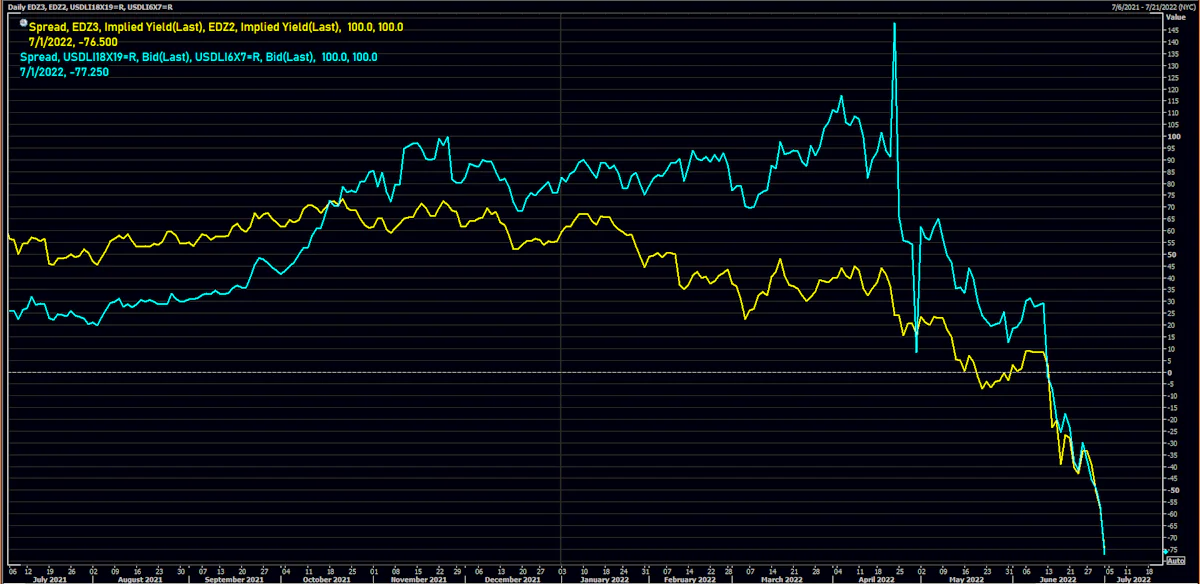
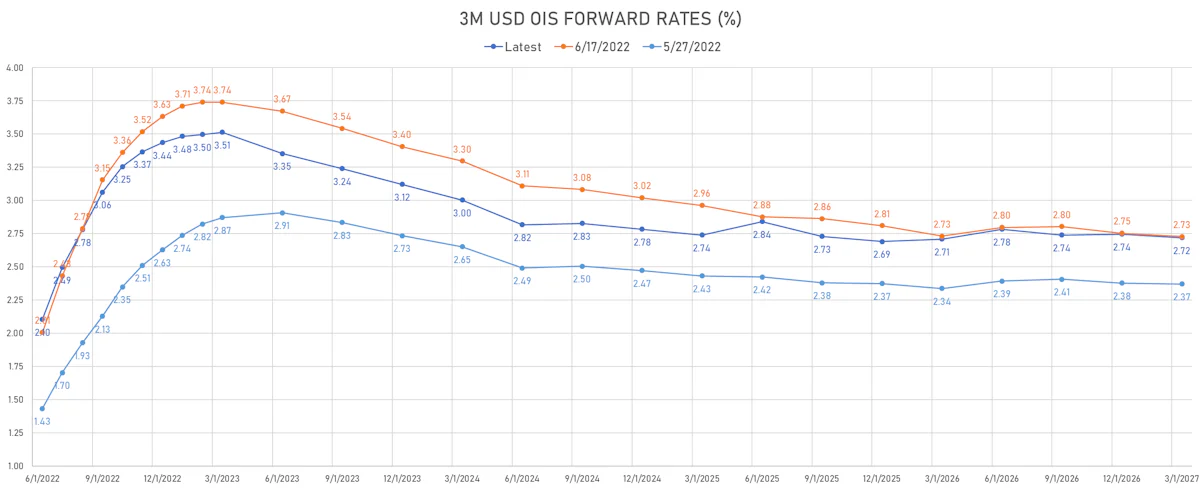
Dramatic Increase In Rates Volatility Into Independence Day Weekend, As Weak Economic Data Pushes Forward Rates To Price In 3 Rate Cuts In 2023
US money markets are now trading below the Fed's dots by the end of the year, with a shortened hiking cycle and rate cuts starting early 2023; the very front end is still holding up, with 75% probability of a 75bp hike in July, but it will be a bad omen for the Fed's hiking policy if the market now makes a push for 50bp in July
Credit
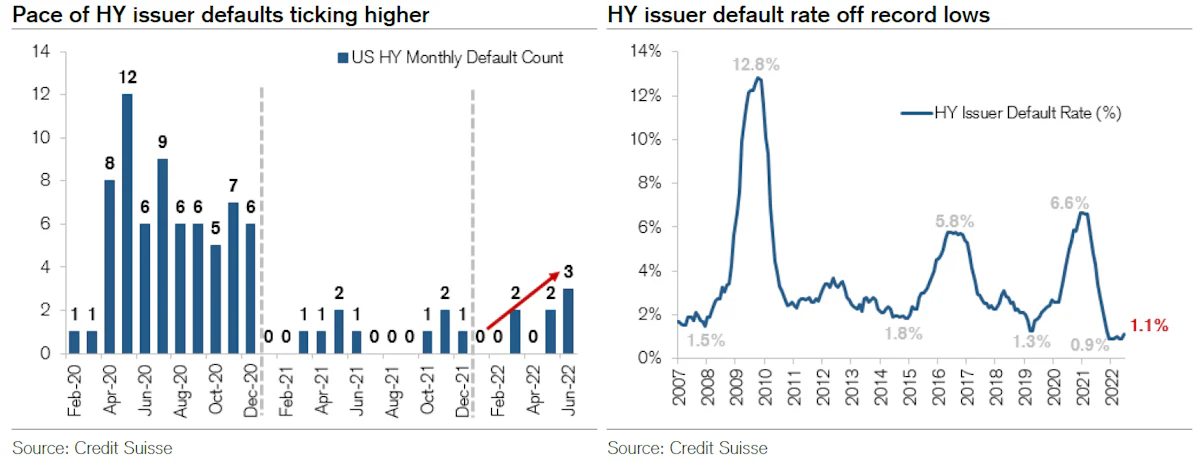
Significant Tightening In Spreads Across The Credit Complex, In Line With Equities Performance, As Credit Defaults Stay Very Low
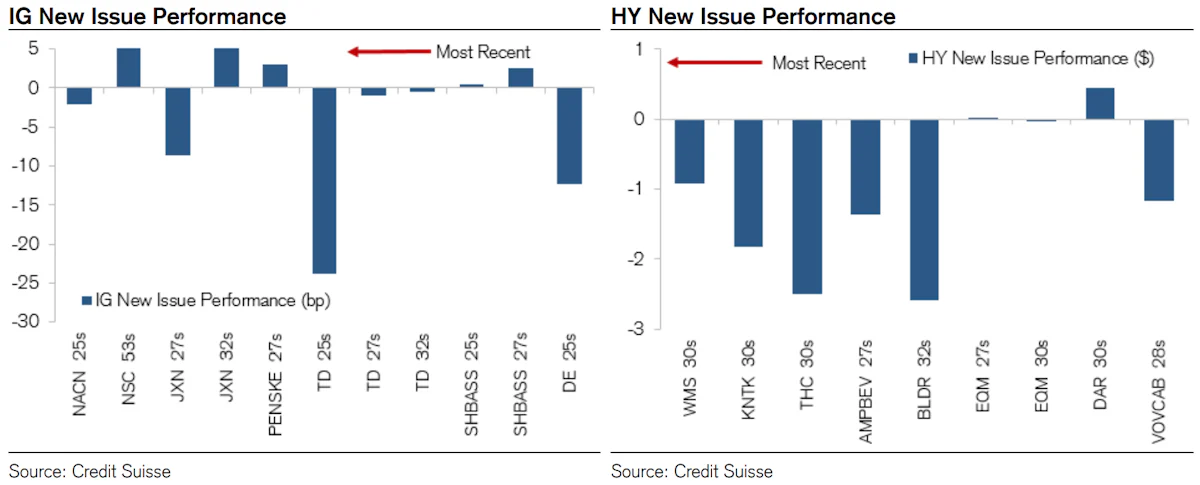
No new corporate bond pricing in US$ HY this week, while IG only saw a modest level of issuance with $10.35bn priced in 13 tranches (2022 YTD volume $727.1bn vs 2021 YTD $824.7bn)
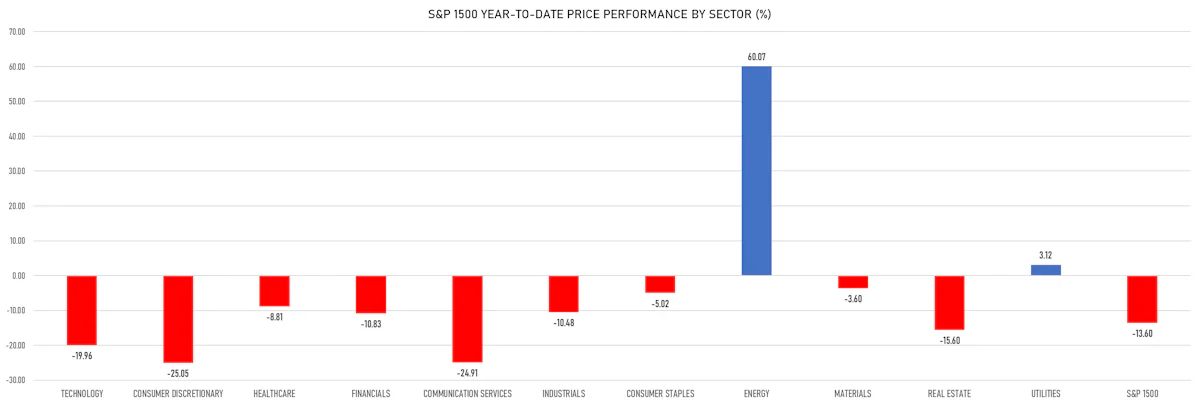
Equities
Good Week For US Equities, Capped By Stellar Performances Into The Weekend, With 96% Of S&P 500 Stocks Up On Friday
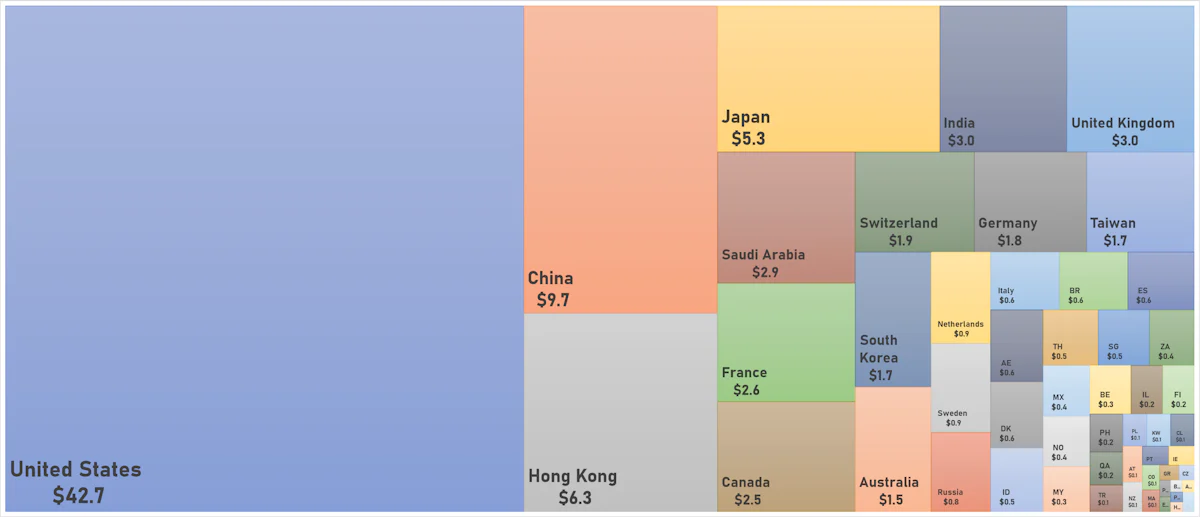
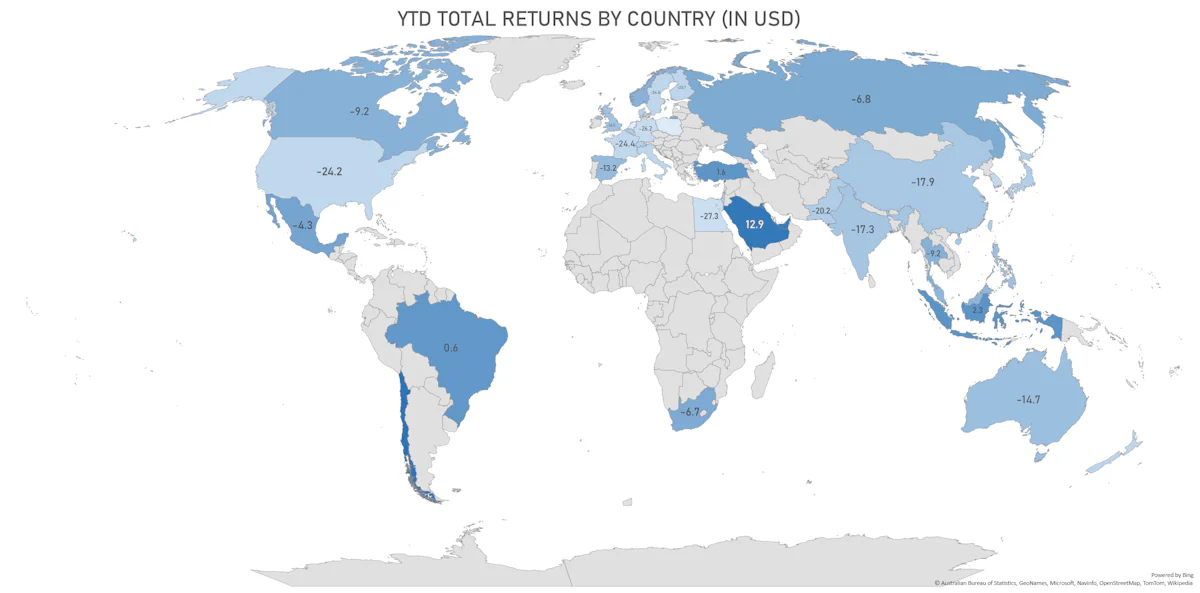
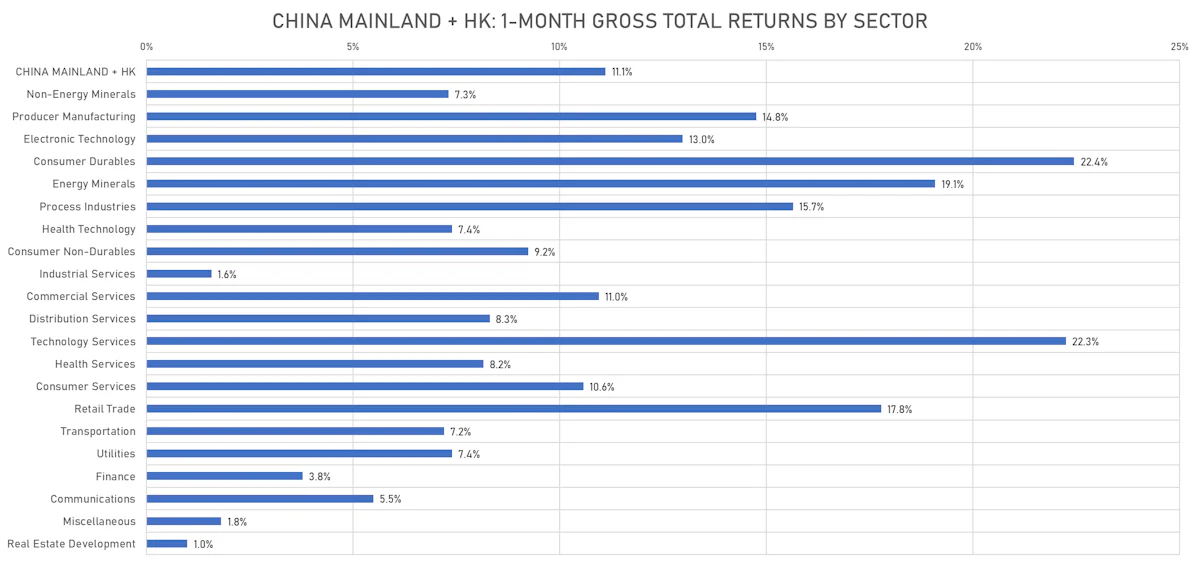
With the rise in energy prices, Middle-Eastern oil-producing countries are among the top performing markets year-to-date (US$ total returns): Saudi Arabia up 8.9% and the UAE up 9.7%
Rates
US Front-End Yields Fell This Week, Mostly Driven By Lower Inflation Breakevens, While The 5s30s Spread In Real Yields Rose
Deutsche Bank and Jefferies both see a US recession as inevitable, but starting in the second half of 2023, while Goldman Sachs now sees a 50% chance of a recession over the next 24 months
Credit
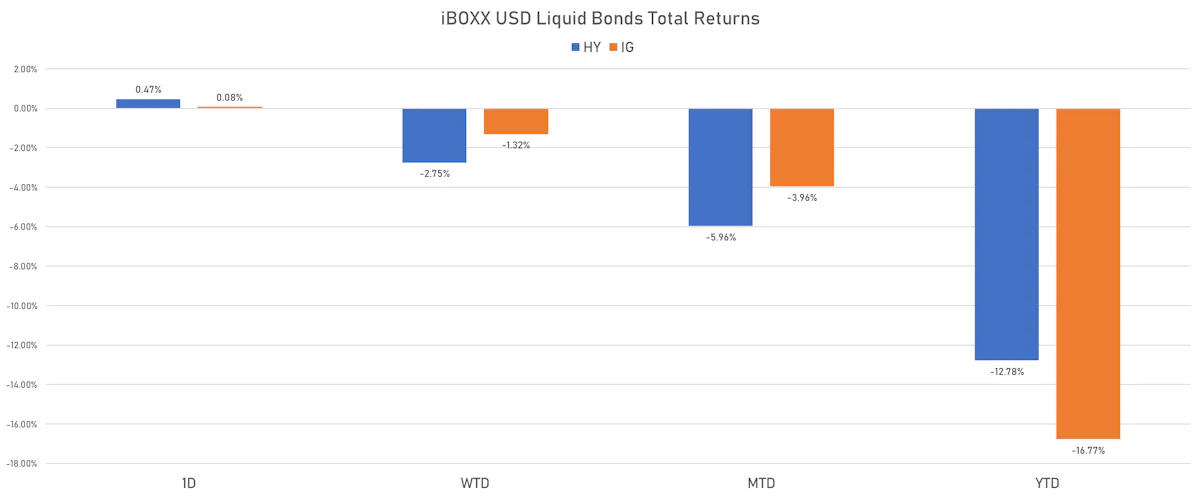
Another Week Of Weak Credit Performance: Widening Credit Spreads Across The Complex, Though Longer Duration Now Getting A Bid
After a difficult start to the year, long duration IG has been a better place than HY lately, with rates rising most at the front end, the yield curve flattening, and HY spreads widening considerably more
Equities
US Equities Dropped Again This Week, Led By Energy, As Talk Of 2023 Recession Hits Industrial Commodities
The initial reaction to the Fed across equities was a compression of multiples, driven by higher real yields, which hit long duration tech stocks the hardest, but the focus is now shifting to earnings growth and possible downgrades with a marked deterioration in the economic outlook
Rates
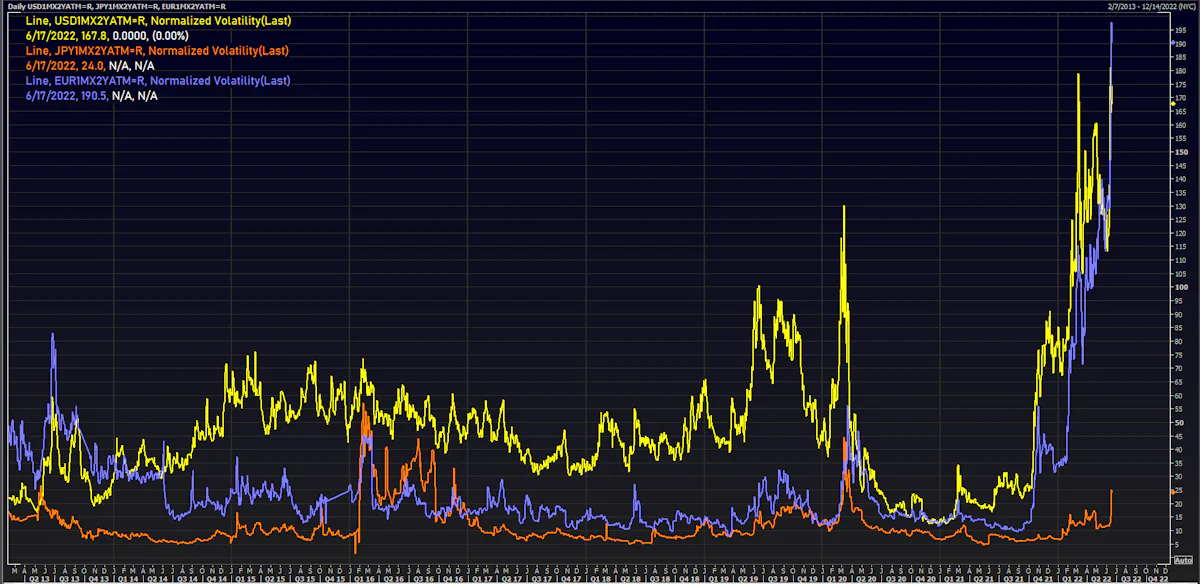
Massive Volatility Across The Rates Complex This Week With Announcements From The Fed, ECB, BoJ; US Curve Flattens Further As Data Mostly Disappoints
Money markets in the US are now very confident that 75bp will be realized at the July FOMC, with probably 50bp hikes in both September and November, and 25bp in December; some banks (like Goldman Sachs) think Fed hikes will be done by the end of this year, as the tightening in financial conditions has increased the likelihood of a hard landing and recession next year
Credit
Significant Widening In US HY Credit Spreads This Week, With OAS On ICE BofA Cash Index 30bp Wider
Weekly volumes of USD corporate bonds (IFR data): 46 tranches for $34.75bn in IG (2022 YTD volume $716.79bn vs 2021 YTD $778.32bn), 6 tranches for $3.15bn in HY (2022 YTD volume $66.071bn vs 2021 YTD $263.313bn)
Equities
Chinese Stocks Continue To Rebound While US Equities Slide Again: S&P 500 Down 5.1%, NASDAQ Composite Down 5.6% For The Week
The dollar continues to strengthen, with the DX up 2% this week (and close to 9% YTD), and we're starting to see a number of global US corporates revise their earnings guidance lower because of it (most notably MSFT last week)
Rates
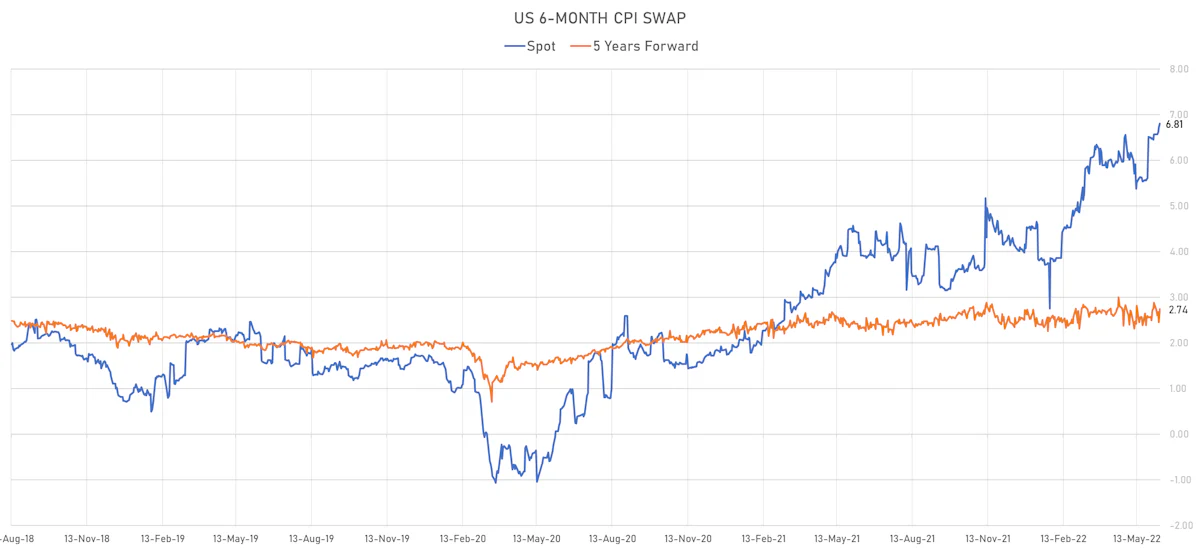
US Breakevens Jumped At The Front End Of The Curve This Week, With The CPI Surprise Today Bringing The Spot 2s10s Treasury Spread Close To Inversion
Pricing of Fed hikes in money markets jumped, as did rates volatility: 50 basis points are now priced for the September FOMC, while the November meeting seems to be the new battleground for a possible slowdown of the hiking pace to 25bp
Credit
US Credit Spreads Broadly Wider On Friday, Though IG Cash Spreads Were 3bp Tighter For The Week
Weekly IFR totals for US corporate bond issuance: 36 tranches for US$29.9bn in IG (2022 YTD volume $682.0bn vs 2021 YTD $742.4bn), 8 tranches for $6.55bn in HY (2022 YTD volume $62.9bn vs 2021 YTD $254.4bn)
Equities
US Equities Fell This Week, With The Exception Of Energy Stocks, While Chinese Markets Jumped As Shanghai Reopened
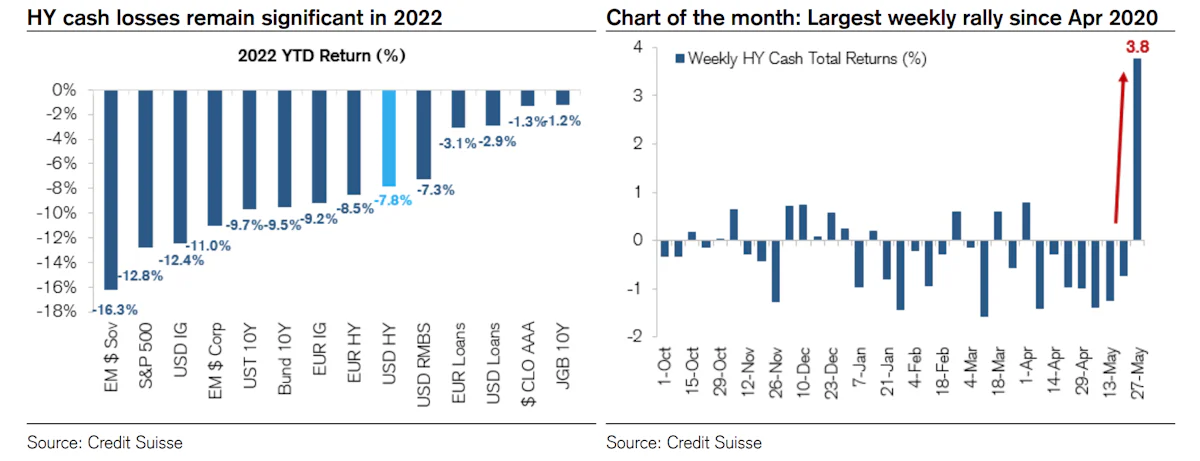
The S&P 500 total return this year through May is -12.8%: May was flat, value continued to overperform growth (1.9% vs. -2.3%), with the energy sector delivering 15.8% returns last month (energy up 58.5% YTD)