Rates
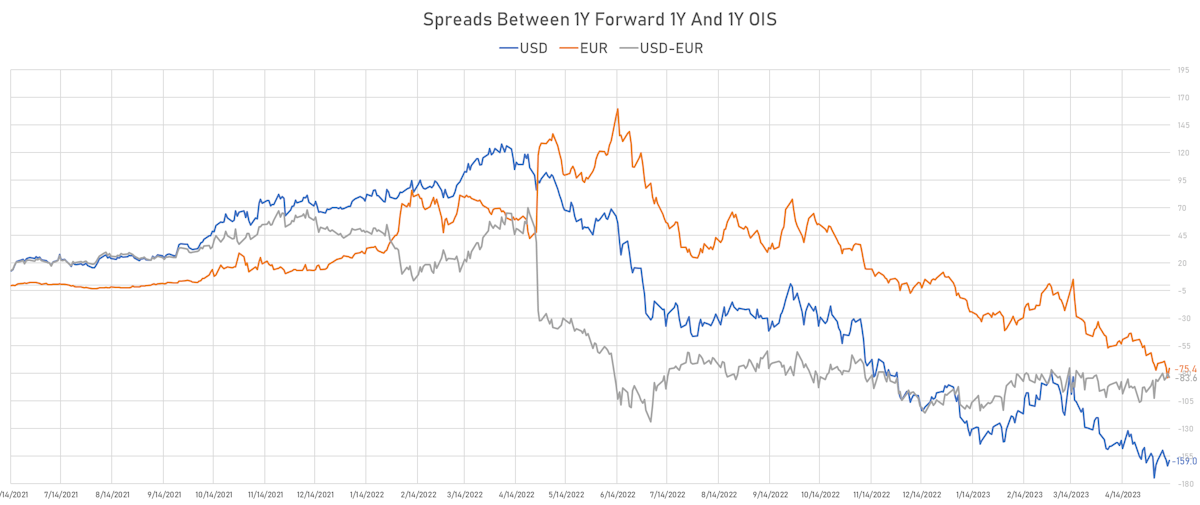
Strong Selloff In USD Rates Partially Undone Before The Weekend, As The Debt Ceiling Issue Remains Top Of Mind
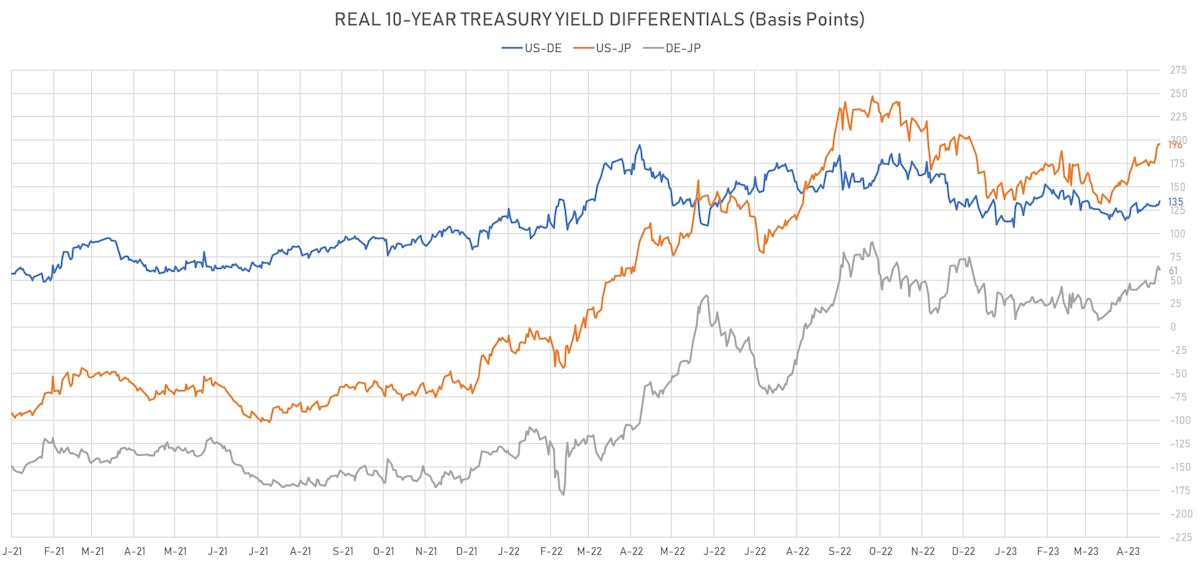
The US dollar has benefited from the positive dynamics in rates differentials across currencies, especially with the JPY where too much was expected too soon from the new CB governor
Credit
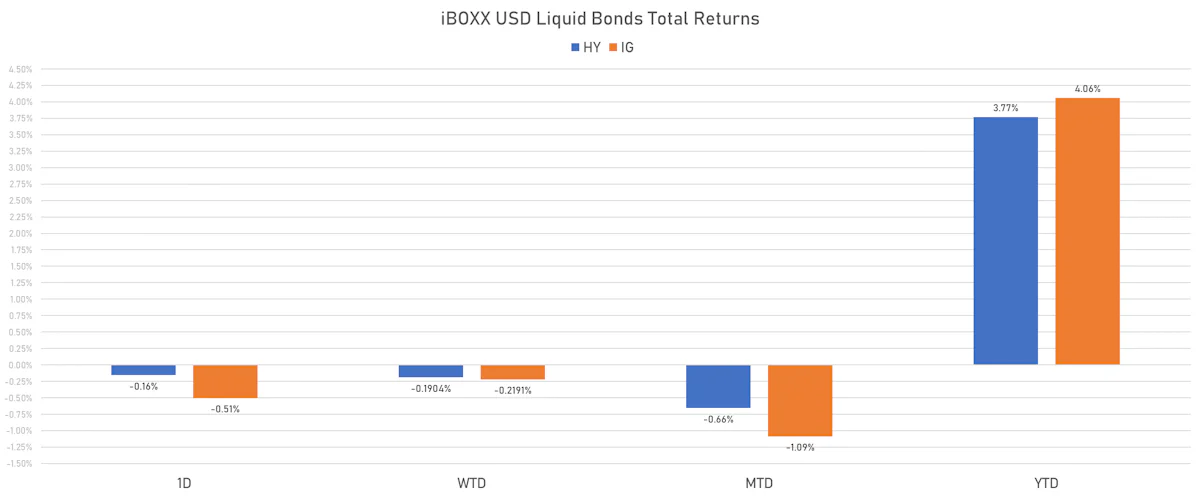
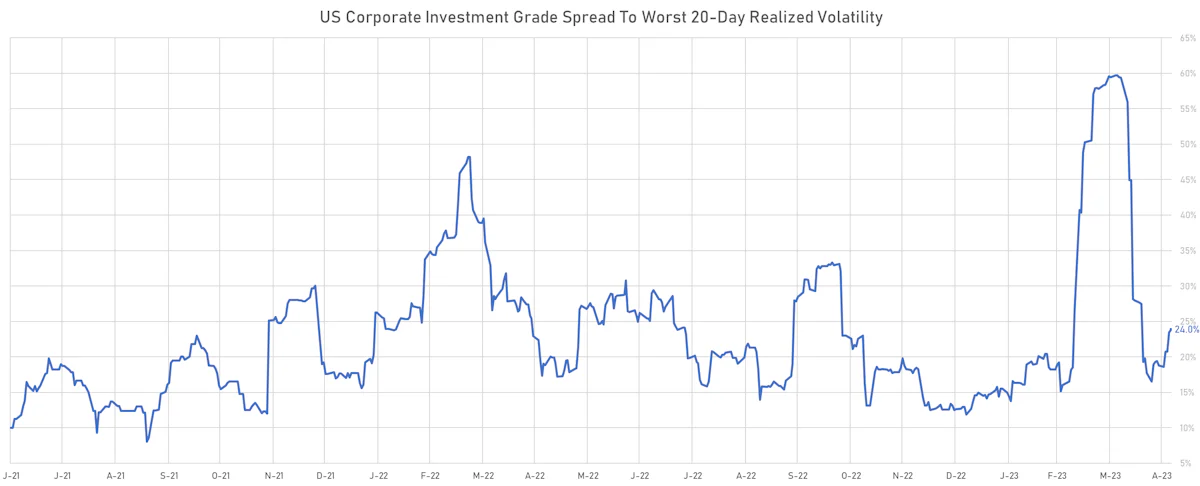
Duration In Driver's Seat, As US Cash Spreads Broadly Unchanged Over The Past Week
Solid weekly US new issue volumes: 43 tranches for $35.1bn in IG (2023 YTD volume $535.04bn vs 2022 YTD $618.041bn), 5 tranches for $3.74bn in IG (2023 YTD volume $68.112.6bn vs 2022 YTD $55.371bn)
Equities
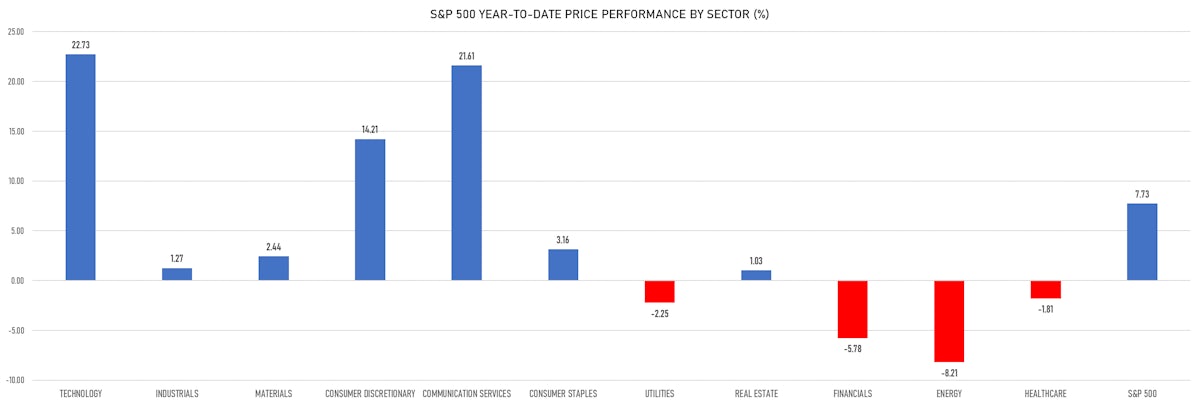
Tech Outperformed The S&P 500 By 5% This Week As Mega Caps Continue To Lead US Equities
Net margins for the first quarter have contracted much less than expected (99bp vs 146bp) but investors remain very prudent, pointing to a possible upward path as long as growth remains fairly robust
Rates
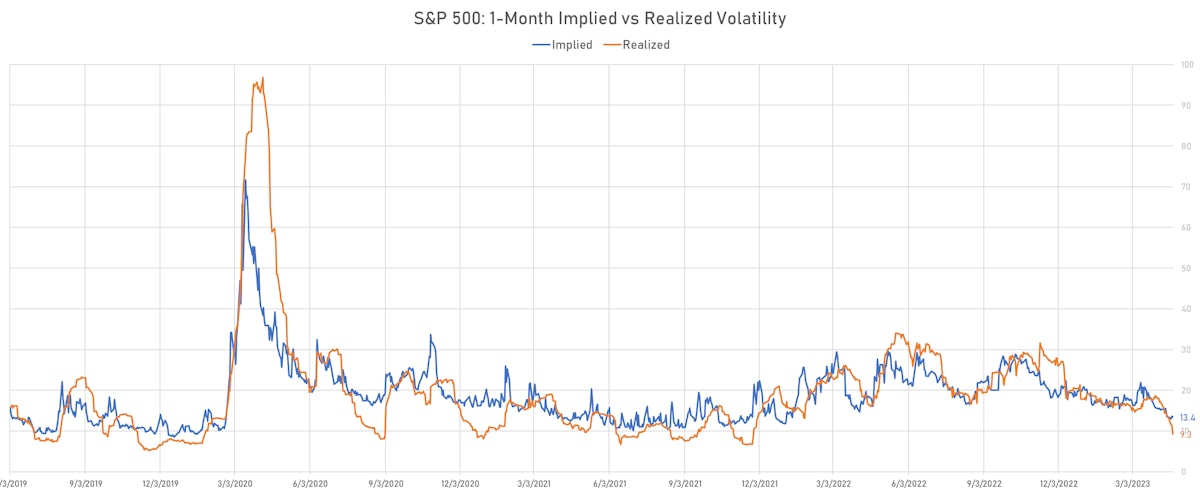
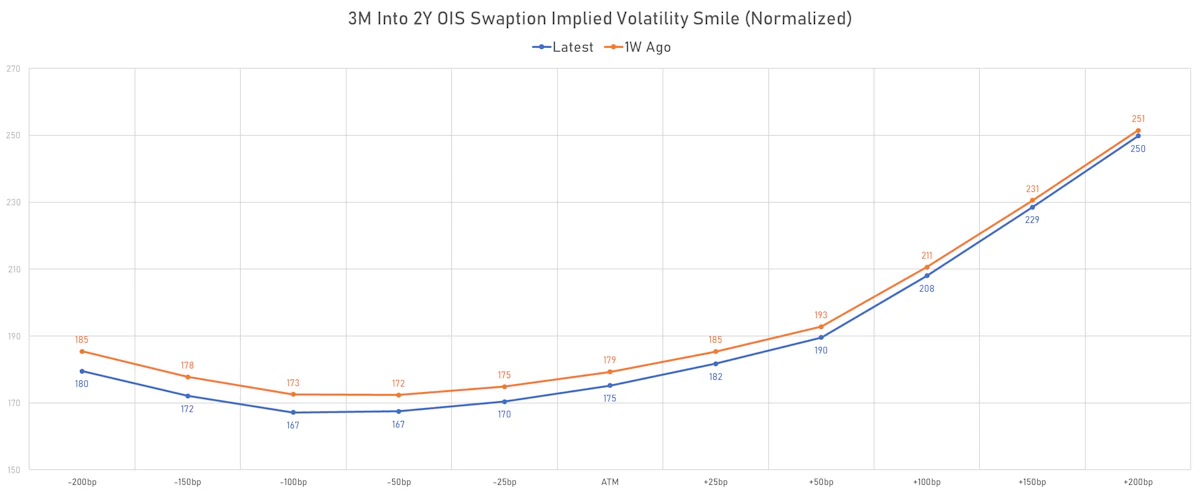
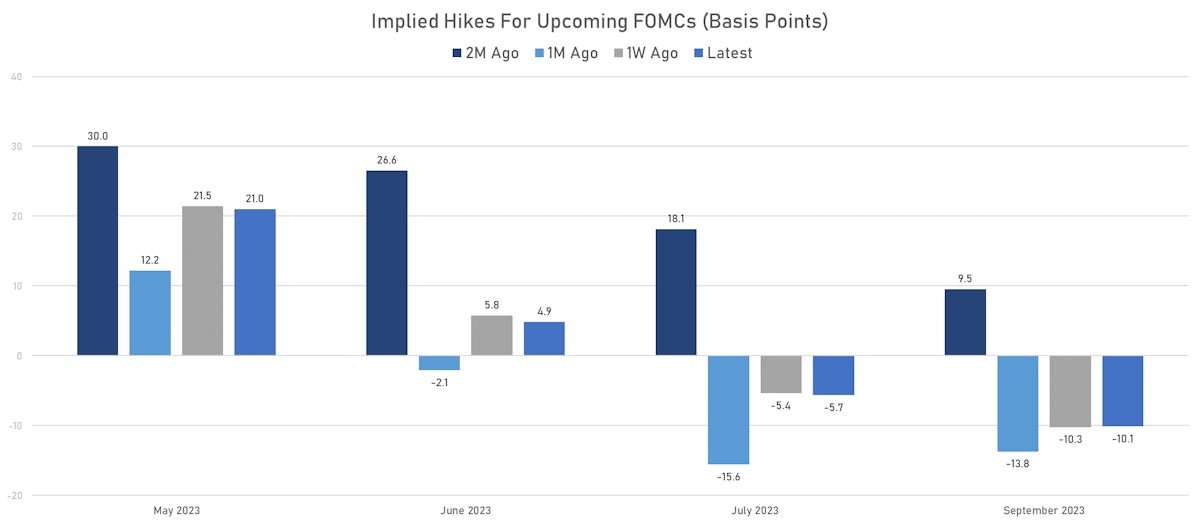
US Short-Term Rates Volatility Dropped This Week As Conviction In A Fed Pause Increased
With the right tail of the peak rate distribution now all but priced out, strength in incoming data could slowly tip the scale away from worries about a recession and regional banks failures
Credit
USD Cash Spreads Broadly Wider This Week, Despite Strong Finish On Friday
USD corporate bond issuance rebounded this week (IFR Markets data): 29 tranches for $30.05bn in IG (2023 YTD volume $499.94bn vs 2022 YTD $593.89bn), 6 tranches for $5.8bn in HY (2023 YTD volume $64.372bn vs 2022 YTD $54.171bn)
Equities
US Equities Continue To Trade Sideways, Caught Between Solid Economic Data And Regional Banking Crisis
85% of the S&P 500 market cap has now reported 1Q23: the blended revenue growth rate stands at 3.9% and EPS growth rate at -2.2% (vs -6.7% expected) according to FactSet's latest Earnings Insight report
Rates
US Front-End Rates Inversion Deepens As FOMC Takes A Backseat To Other Concerns
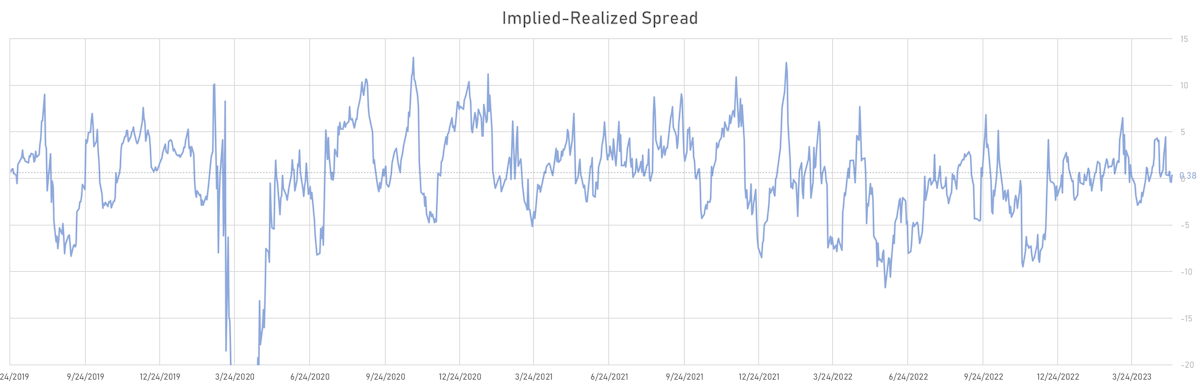
USD rates volatility remains extremely high, especially in the right tail: forward rates have come down to reflect a more benign policy path for the Fed, but market participants are hedging the possibility of dislocation over the next 3 months
Credit
Despite The Volatility Scare In March, USD Cash Spreads Have Barely Moved YTD
Modest amount of US$ bond issuance for corporates this week: 21 tranches for $17.85bn in IG (2023 YTD volume $469.89bn vs 2022 YTD $577.641bn), 4 tranches for $3.12bn in HY (2023 YTD volume $58.572bn vs 2022 YTD $54.171bn)
Equities
US Equities Gained 50bp Over The Past Week, Capping April Total Returns Of 85bp
Close to two thirds of the S&P 500 by market cap has now reported 1Q 2023 earnings, and results have been better than expected (still bad), down 5% YoY against a consensus estimate of -7%
Rates
Front End Rates Volatility Remains High, With Decent Economic Data And Some More Drama From FRC
The Fed will undoubtedly lift its policy rate by 25bp to 5+1/8 this week, but we would be surprised if they explicitly called it the last hike of the current cycle
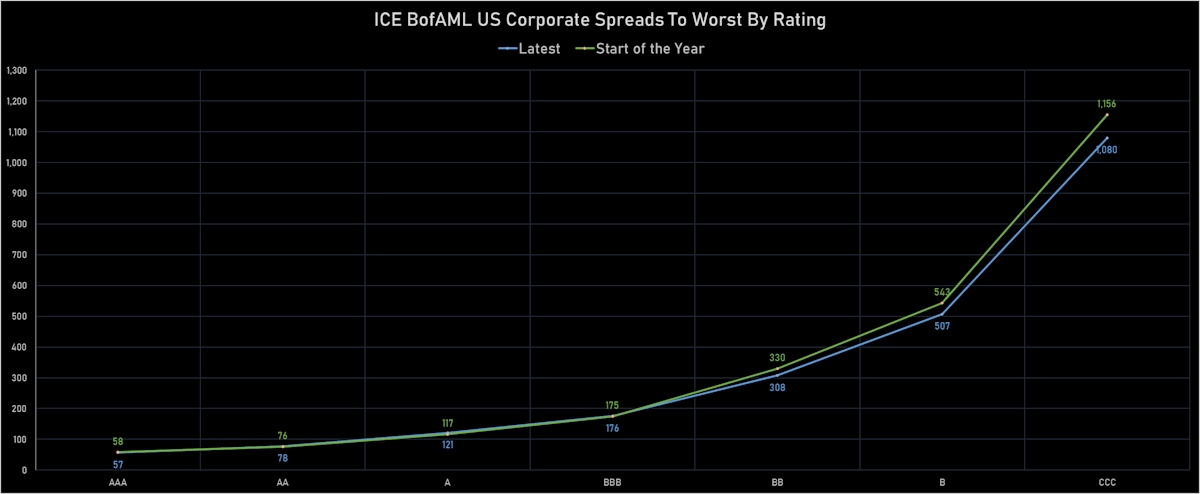
Credit
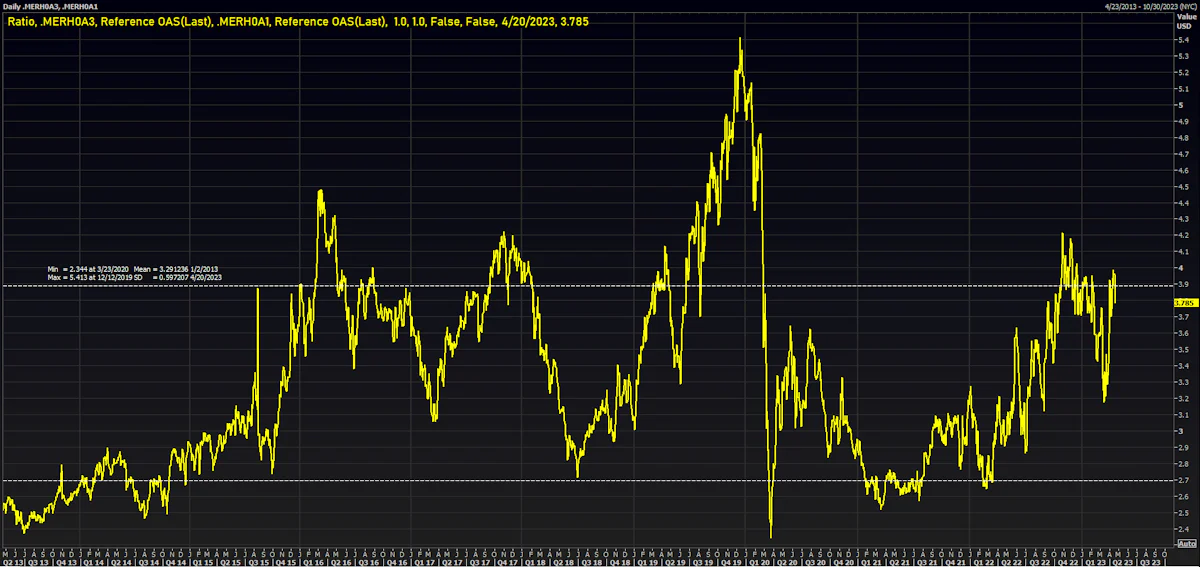
USD Cash Spreads Mixed This Week, With Renewed Compression In The CCCs/BBs OAS Ratio
USD bond issuance returns as earnings start rolling in: 19 tranches for $30.75bn in IG (2023 YTD volume $452.04bn vs 2022 YTD $567.541bn), 6 tranches for $3.615bn in HY (2023 YTD volume $53.327bn vs 2022 YTD $49.646bn)
Equities
US Equities Unchanged This Week On String Of Low Volume, Low Volatility Sessions
1Q23 earnings so far are slightly better than expected, though still bad: the blended quarterly decline currently at -6.2%, with 53% of companies beating consensus estimates by at least 1 standard deviation (vs 25-year average of 48%)